Advertisement
- United States
- /
- Insurance
- /
- NYSE:CNA
CNA Financial (CNA): Assessing Valuation Following Strong Earnings, Dividend Affirmation, and Leadership Changes

Simply Wall St
Reviewed by Simply Wall St
CNA Financial (CNA) just posted stronger earnings and revenue for the third quarter and nine-month period. The company also affirmed its quarterly dividend and announced changes to its board and executive team.
See our latest analysis for CNA Financial.
CNA Financial’s latest round of upbeat results and leadership changes has caught investors’ attention, with the share price advancing 2.33% in just one day. While the stock has pulled back year-to-date, long-term shareholders have enjoyed a robust total return of 84% over the past five years. This suggests momentum remains healthy even as near-term sentiment shifts.
If you’re curious about what else seasoned investors are watching, now’s an ideal moment to broaden your search and discover fast growing stocks with high insider ownership
With shares rebounding after upbeat earnings yet still lagging for the year, the real question is whether CNA Financial is trading at a discount or if the market has already factored in its growth potential.
Price-to-Earnings of 12.3x: Is it justified?
CNA Financial is currently trading on a price-to-earnings (P/E) ratio of 12.3x, noticeably below its peer average and industry benchmark. With a last close price of $45.23, the shares appear attractively priced versus typical levels across the insurance sector, hinting that investors may be undervaluing future profitability.
The price-to-earnings ratio reflects how much investors are willing to pay for each dollar of annual earnings. For insurance companies like CNA Financial, this metric is especially relevant as it allows for quick comparisons of market sentiment and growth prospects versus industry rivals, giving a pulse on whether the stock is seen as a bargain or carries a premium.
CNA’s P/E ratio stands at 12.3x, meaningfully lower than both the industry average (13.2x) and the peer group average (13.4x). It also trades below what our model views as a fair P/E (16.3x), suggesting significant value potential if market perceptions improve or earnings meet forecasts. If sentiment in the sector shifts, CNA could re-rate closer to this fair ratio.
Explore the SWS fair ratio for CNA Financial
Result: Price-to-Earnings of 12.3x (UNDERVALUED)
However, continued underperformance relative to year-to-date benchmarks or missed earnings growth could put pressure on the share price, regardless of current valuation.
Find out about the key risks to this CNA Financial narrative.
Another View: What Does the SWS DCF Model Indicate?
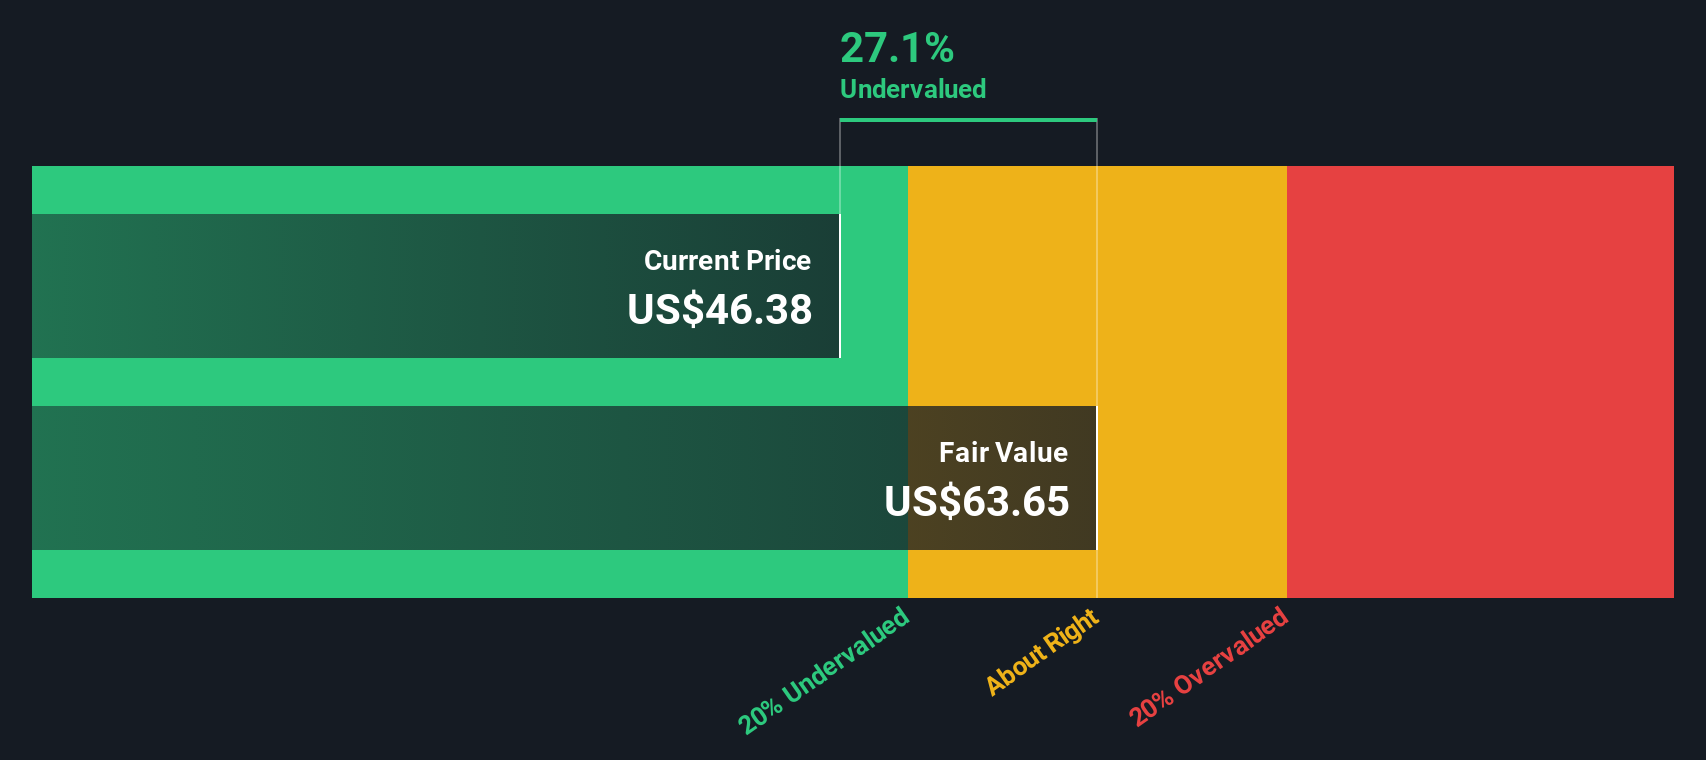
While the price-to-earnings ratio suggests CNA Financial could be undervalued compared to its industry, our DCF model presents an even stronger case for value. According to this approach, the shares trade nearly 29% below our estimate of fair value, indicating notable upside if market expectations align. Could the DCF outlook signal deeper opportunity than the multiples suggest?
Look into how the SWS DCF model arrives at its fair value.
Simply Wall St performs a discounted cash flow (DCF) on every stock in the world every day (check out CNA Financial for example). We show the entire calculation in full. You can track the result in your watchlist or portfolio and be alerted when this changes, or use our stock screener to discover 876 undervalued stocks based on their cash flows. If you save a screener we even alert you when new companies match - so you never miss a potential opportunity.
Build Your Own CNA Financial Narrative
If you have a different perspective or want to dig even deeper, you can explore the numbers and craft your own story in just minutes. Do it your way
A great starting point for your CNA Financial research is our analysis highlighting 3 key rewards and 2 important warning signs that could impact your investment decision.
Ready For Your Next Move? Invest Smarter With Targeted Ideas
Don't let new opportunities pass you by when the next standout investment could be just a click away. Take the lead and give yourself an edge.
- Capitalize on steady portfolio growth by checking out these 16 dividend stocks with yields > 3%, which offers yields over 3% and strong fundamentals.
- Jumpstart your search for tomorrow's tech legends with these 25 AI penny stocks, making breakthroughs in artificial intelligence and machine learning.
- Boost your returns by seeking out serious value among these 876 undervalued stocks based on cash flows, where market mispricings could mean greater upside potential.
This article by Simply Wall St is general in nature. We provide commentary based on historical data and analyst forecasts only using an unbiased methodology and our articles are not intended to be financial advice. It does not constitute a recommendation to buy or sell any stock, and does not take account of your objectives, or your financial situation. We aim to bring you long-term focused analysis driven by fundamental data. Note that our analysis may not factor in the latest price-sensitive company announcements or qualitative material. Simply Wall St has no position in any stocks mentioned.
New: AI Stock Screener & Alerts
Our new AI Stock Screener scans the market every day to uncover opportunities.
• Dividend Powerhouses (3%+ Yield)
• Undervalued Small Caps with Insider Buying
• High growth Tech and AI Companies
Or build your own from over 50 metrics.
Have feedback on this article? Concerned about the content? Get in touch with us directly. Alternatively, email editorial-team@simplywallst.com
About NYSE:CNA
CNA Financial
An insurance holding company, primarily provides commercial property and casualty insurance products in the United States and internationally.
Undervalued established dividend payer.
Similar Companies
Market Insights

Advertisement
Community Narratives
The "Molecular Pencil": Why Beam's Technology is Built to Win
Fair Value US$65.01|65.8% undervalued
DA
Community Contributor
The silent giant behind virtually every advanced chip powering AI, smartphones, and modern infrastructure.
Fair Value US$310.00|7.6% undervalued
OS
Community Contributor
ADP Stock: Solid Fundamentals, But AI Investments Test Its Margin Resilience
Fair Value US$387.77|34.5% undervalued
YI
Community Contributor