Advertisement
- United States
- /
- Household Products
- /
- NYSE:PG
What Recent Weakness Means for P&G Shares After Strong Three-Year Gains

Simply Wall St
Reviewed by Bailey Pemberton
Thinking about what to do with Procter & Gamble stock? You’re not alone. Whether you already hold shares or are just considering a new position, there’s plenty to evaluate about this household name. Over the past few years, this consumer goods giant has managed to stay in the spotlight, but following a strong three-year gain of 25.3%, Procter & Gamble's share price has pulled back by 10.1% so far this year. In fact, the last month alone saw the stock dip by 5.5%, which has some investors wondering if the company’s legendary blue-chip reputation is being put to the test or if this is just a temporary pause in its long-term growth story.
Some of this recent weakness comes as investors have rotated toward other sectors, looking for less defensive plays as market sentiment has shifted. Even so, Procter & Gamble still boasts a five-year return of 18.5%, demonstrating resilience across market cycles. With this mix of near-term caution and long-term outperformance in mind, it’s time to focus on the real question that matters for confident investing: valuation. By looking closely at how Procter & Gamble scores on a range of valuation checks, we’ll get a clearer picture of whether those recent declines signal an opportunity or a warning sign. The company currently scores a 4 out of 6 on our valuation scorecard, which points to some intriguing undervaluation signals. Up next, we will dive into what those different valuation approaches actually reveal and explore if there is an even smarter way to understand what the market might be missing.
Approach 1: Procter & Gamble Discounted Cash Flow (DCF) Analysis
The Discounted Cash Flow (DCF) model estimates a company’s intrinsic value by projecting its future free cash flows and discounting them back to today’s value. For Procter & Gamble, this approach provides a detailed look at its underlying earning power, based on cash generation both now and well into the future.
Right now, Procter & Gamble is generating free cash flow of $14.40 billion, with analysts forecasting steady growth. Projections show free cash flow rising to $17.20 billion in 2028, and Simply Wall St extrapolates further long-term growth, with FCF expected to reach $22.47 billion by 2035. All valuations and cash flows are reported in $.
Using these projections and discounting them with a two-stage method, the DCF analysis calculates an estimated fair value of $195.60 per share. Compared to the current share price, this suggests the stock is trading at a 23.7 percent discount to its intrinsic value, which indicates the shares are notably undervalued based on long-term cash flow potential.
Result: UNDERVALUED
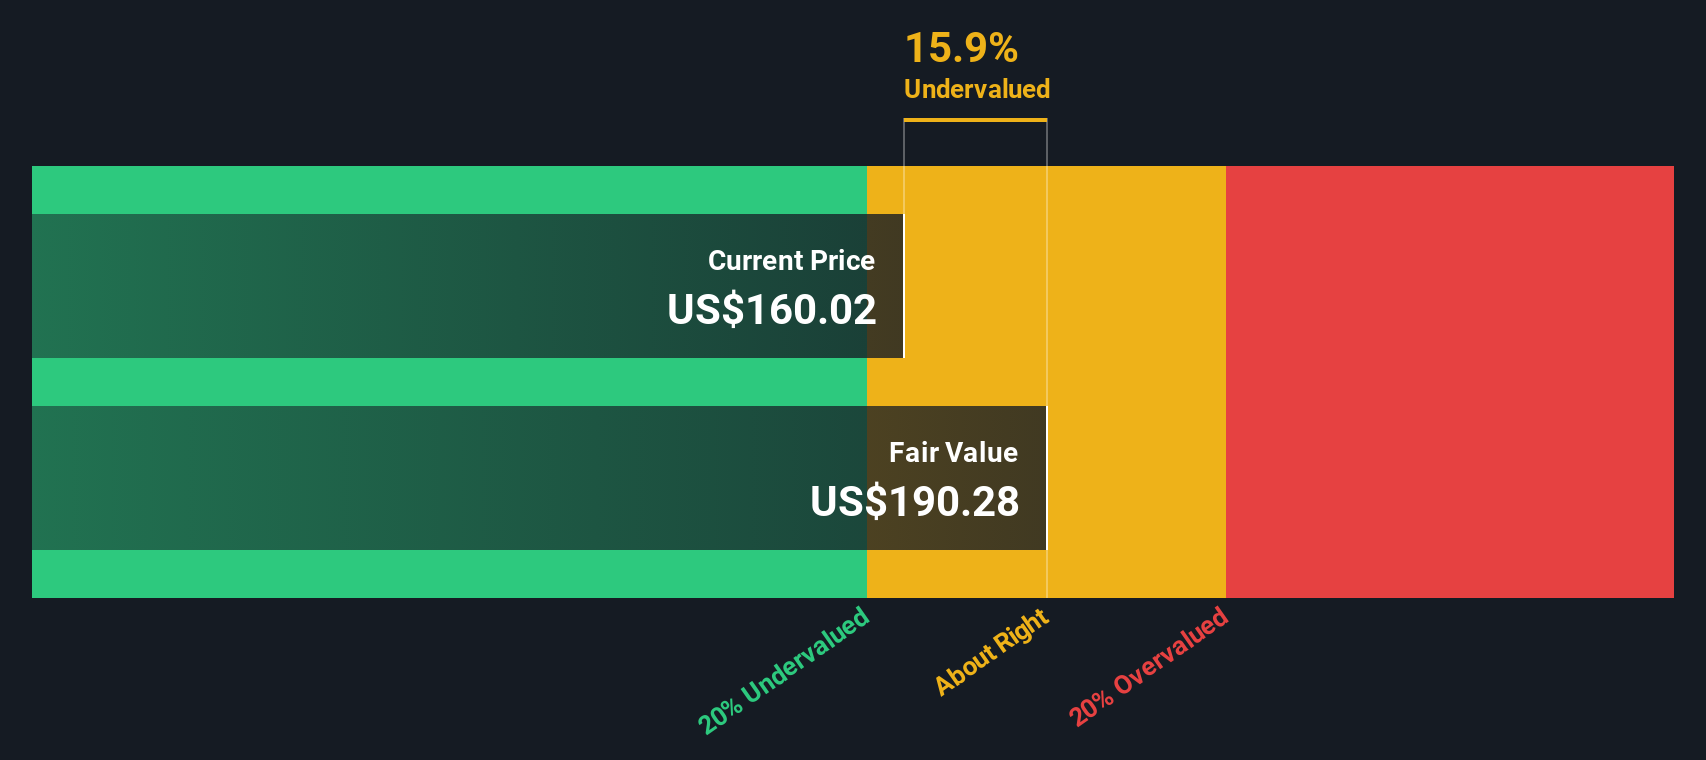
Our Discounted Cash Flow (DCF) analysis suggests Procter & Gamble is undervalued by 23.7%. Track this in your watchlist or portfolio, or discover more undervalued stocks.
Approach 2: Procter & Gamble Price vs Earnings
The Price-to-Earnings (PE) ratio is a time-tested approach for valuing profitable companies like Procter & Gamble. It measures how much investors are willing to pay for each dollar of a company’s earnings, making it especially relevant for mature businesses with solid profits. A “normal” or fair PE ratio usually reflects a company’s future growth prospects as well as its risk profile, with faster-growing and less risky firms typically justifying higher multiples.
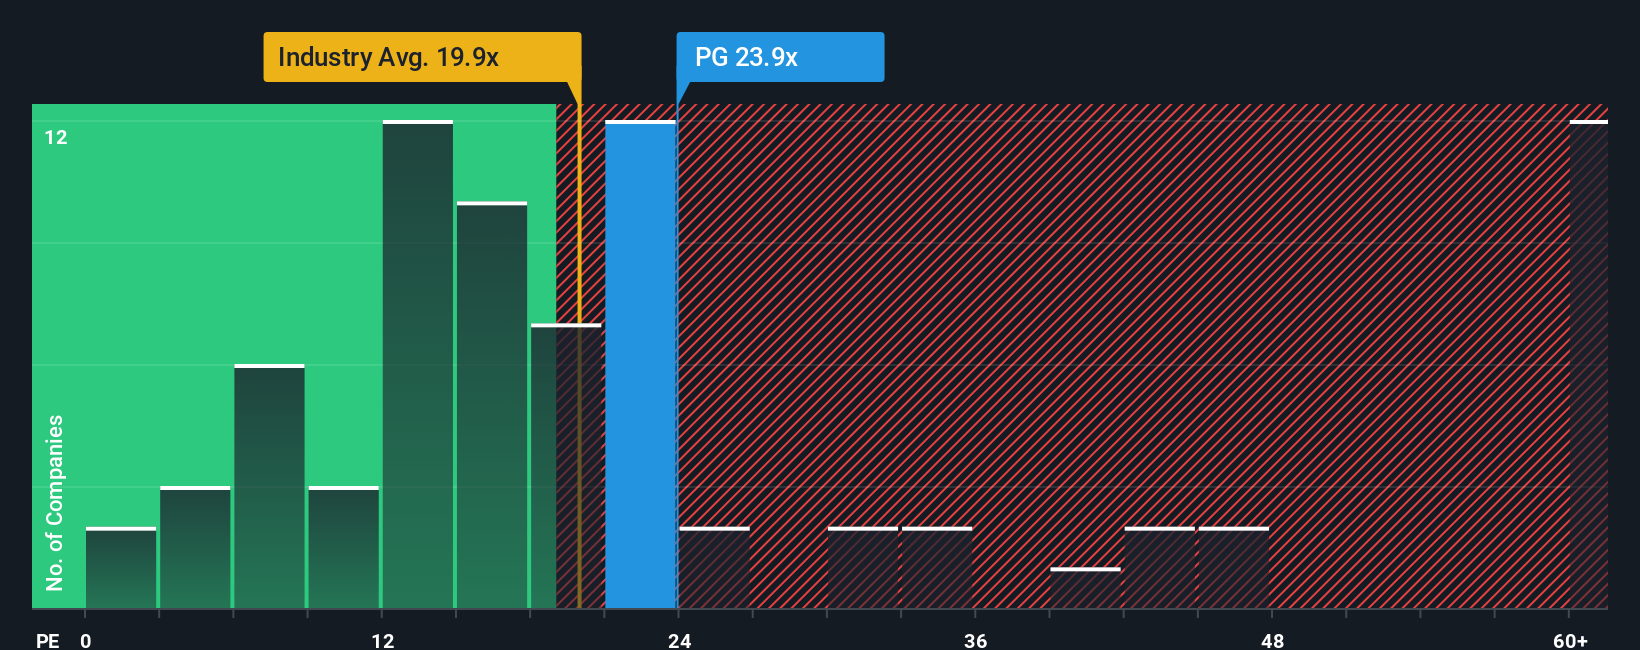
Currently, Procter & Gamble trades on a PE ratio of 22.3x. For context, this is below both the average for its household products industry, which stands at 18.5x, and the peer group average of 24.1x. However, benchmarks like these do not always capture everything that is unique about a company. That is where Simply Wall St’s “Fair Ratio” comes into play. For Procter & Gamble, this proprietary calculation is 27.5x, which is noticeably higher than its current PE.
The Fair Ratio blends in all the key variables that should drive a company’s valuation, from earnings growth and profit margins to industry dynamics and the company’s specific risk factors. Unlike simple comparisons to peers or broad industry averages, it offers a more comprehensive benchmark tailored just for Procter & Gamble’s situation.
When you line up Procter & Gamble’s actual PE ratio of 22.3x with its Fair Ratio of 27.5x, the stock appears undervalued based on what investors might reasonably expect given its earnings profile and market standing.
Result: UNDERVALUED
PE ratios tell one story, but what if the real opportunity lies elsewhere? Discover companies where insiders are betting big on explosive growth.
Upgrade Your Decision Making: Choose your Procter & Gamble Narrative
Earlier we mentioned there is an even better way to understand valuation, so let’s introduce you to Narratives. Narratives put the story behind your investment front and center. They let you connect your beliefs about Procter & Gamble’s future (from growth to margins) directly to a fair value estimate, using your own assumptions or forecasts. Rather than just looking at numbers, a Narrative links the company’s business story with a financial forecast and then calculates what you think the shares are really worth.
This approach is both powerful and accessible. It is built right into Simply Wall St’s Community page, where millions of investors share and update their Narratives alongside new company news or earnings releases. With Narratives, you can see exactly how your outlook stacks up: if your Fair Value is above today’s market price, it could signal a buying opportunity, while a lower Fair Value may suggest caution.
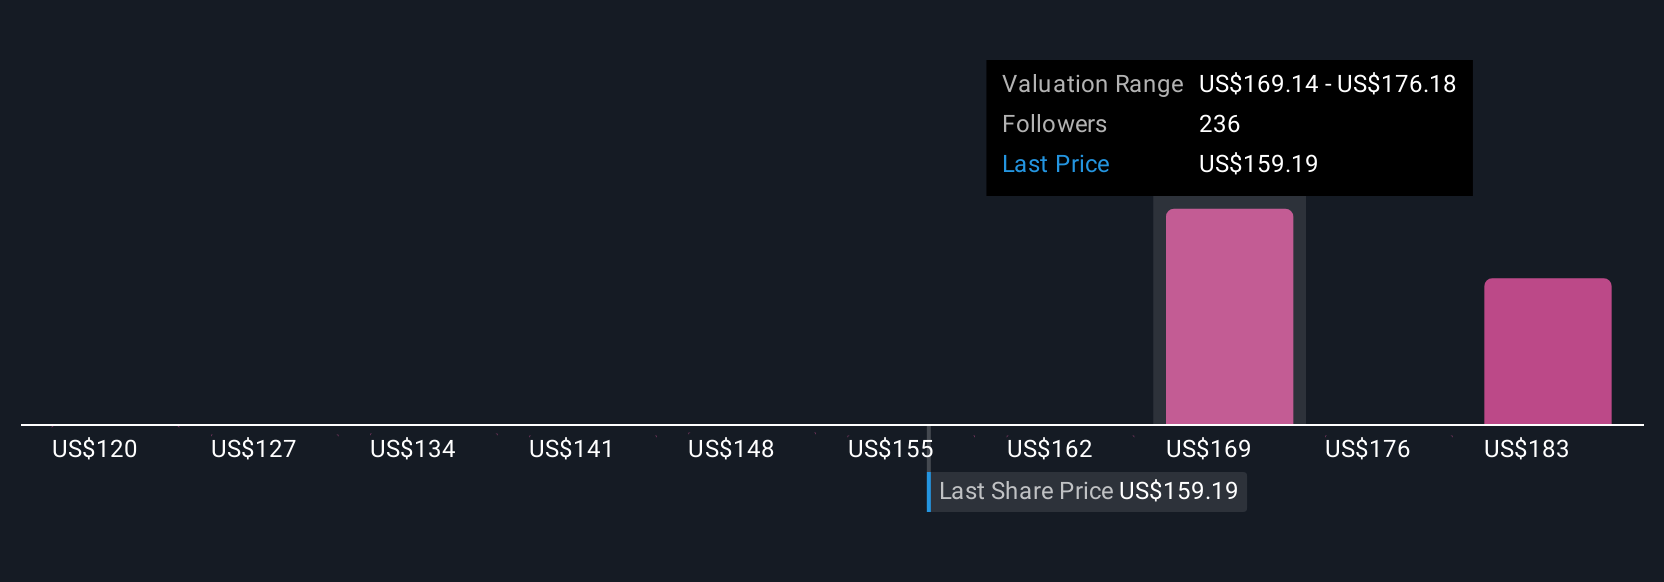
Because Narratives update dynamically as new information arises, they help you stay on top of your investment case in real time. For example, some investors currently see Procter & Gamble’s Fair Value as high as $170 based on optimistic assumptions for growth and margins, while others see more caution and assign values closer to $120.
For Procter & Gamble, here is an easy overview with previews of two leading Procter & Gamble narratives:
Fair Value: $170.96
Current Price Discount: 12.8%
Expected Revenue Growth: 3.3%
- Investments in product innovation and productivity could boost market share, revenues, and net margins even in a challenging environment.
- Analysts forecast annual revenue growth of 3.3%, margin expansion to 19.2%, and earnings per share rising to $7.68 by 2028, requiring a future PE of 26.8x.
- Risks include volatility in key markets, geopolitical tensions, tariffs, and currency fluctuations. Analysts see the stock as fairly valued at current levels.
Fair Value: $119.81
Current Price Premium: 24.5%
Expected Revenue Growth: 4.7%
- Procter & Gamble’s dividend track record is strong, but moderate future growth and a high current price limit upside.
- Valuation models blend DCF, dividend discount, and historical yield/PE. All suggest the current share price sits above estimated fair value.
- Unless margins or revenues surprise to the upside, the stock may remain overvalued, though it continues to offer stability and reliable dividends.
Do you think there's more to the story for Procter & Gamble? Create your own Narrative to let the Community know!
This article by Simply Wall St is general in nature. We provide commentary based on historical data and analyst forecasts only using an unbiased methodology and our articles are not intended to be financial advice. It does not constitute a recommendation to buy or sell any stock, and does not take account of your objectives, or your financial situation. We aim to bring you long-term focused analysis driven by fundamental data. Note that our analysis may not factor in the latest price-sensitive company announcements or qualitative material. Simply Wall St has no position in any stocks mentioned.
New: Manage All Your Stock Portfolios in One Place
We've created the ultimate portfolio companion for stock investors, and it's free.
• Connect an unlimited number of Portfolios and see your total in one currency
• Be alerted to new Warning Signs or Risks via email or mobile
• Track the Fair Value of your stocks
Have feedback on this article? Concerned about the content? Get in touch with us directly. Alternatively, email editorial-team@simplywallst.com
About NYSE:PG
Outstanding track record established dividend payer.
Similar Companies
Market Insights

Advertisement
Community Narratives
Finding The True Value Of A Logistics Powerhouse
Fair Value US$95.21|8.5% undervalued
NV
Community Contributor
Paradigm Biopharmaceuticals Will Lead Osteoarthritis Treatment with Zilosul's FDA Success
Fair Value AU$5.50|91.9% undervalued
AM
Community Contributor
Barrick Mining (ABX:CA): A Gold Hedge against a U.S. Shutdown
Fair Value CA$60.00|26.5% undervalued
GM
Community Contributor