Advertisement
- United States
- /
- Household Products
- /
- NYSE:PG
Is There Now an Opportunity in P&G Shares After Recent 1.6% Weekly Rise?

Simply Wall St
Reviewed by Bailey Pemberton
If you are considering your next move with Procter & Gamble, you are definitely not alone. Investors everywhere are weighing whether to buy, hold, or even trim their positions as this blue-chip stock meanders through a surprising patch. In the last week, Procter & Gamble shares crept up 1.6%, offering a hint of renewed optimism after a month in which the stock slipped 2.8%. Year-to-date and over the past twelve months, the stock has slid close to 9%, a somewhat unexpected pullback for a company synonymous with stability. Yet, if you step back a little further, you will see a different narrative: shares are still up nearly 20% in the past five years and 24.1% over three years, a testament to the brand’s staying power even when sentiment wobbles.
These back-and-forth moves partly trace to headlines around global consumer trends and supply chain shifts. Recent news has spotlighted Procter & Gamble’s efforts to manage input costs and steer through changing demand patterns. Product innovation in categories like home care and personal health has also played a role. While these do not always spark dramatic price swings in the short term, they shape investor expectations for future profitability and growth.
So, how does all this feed into the current valuation? According to our scorecard, Procter & Gamble ticks the box for being undervalued in 4 out of 6 key categories. That delivers a respectable value score of 4, setting up a conversation about whether now is a smart entry point or if caution is still warranted. Next, we will walk through the main valuation models used to assess Procter & Gamble and, later in the article, point to an even more insightful way to understand what this value score really means for your portfolio.
Approach 1: Procter & Gamble Discounted Cash Flow (DCF) Analysis
The Discounted Cash Flow (DCF) model projects a company’s future cash flows and then discounts those back to today’s value to estimate its intrinsic worth. This approach helps investors gauge whether the current share price reflects the real economic value of the business based on its future earning power.
For Procter & Gamble, the latest reported Free Cash Flow stands at $14.4 billion. Analysts estimate moderate, steady growth in the years ahead, with projected free cash flow reaching $22.5 billion by 2035. While analyst forecasts cover around five years, Simply Wall St extrapolates these over a full decade by leveraging recent performance and industry trends.
According to this DCF model, the intrinsic value per share is $195.60. This is 22.5% above the current market price, suggesting the stock is notably undervalued based on future cash generation.
Result: UNDERVALUED
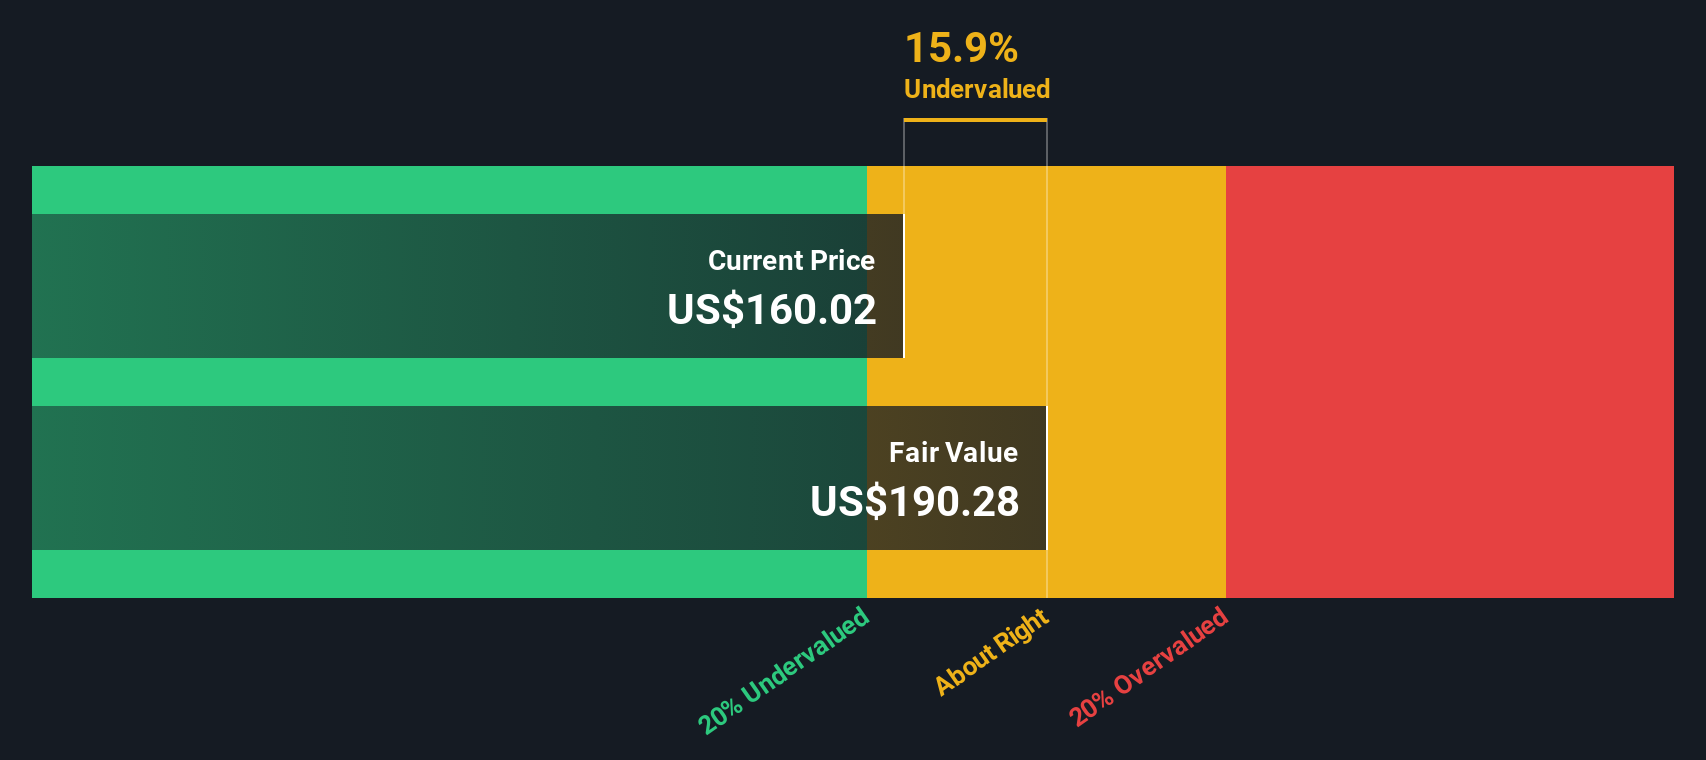
Our Discounted Cash Flow (DCF) analysis suggests Procter & Gamble is undervalued by 22.5%. Track this in your watchlist or portfolio, or discover more undervalued stocks.
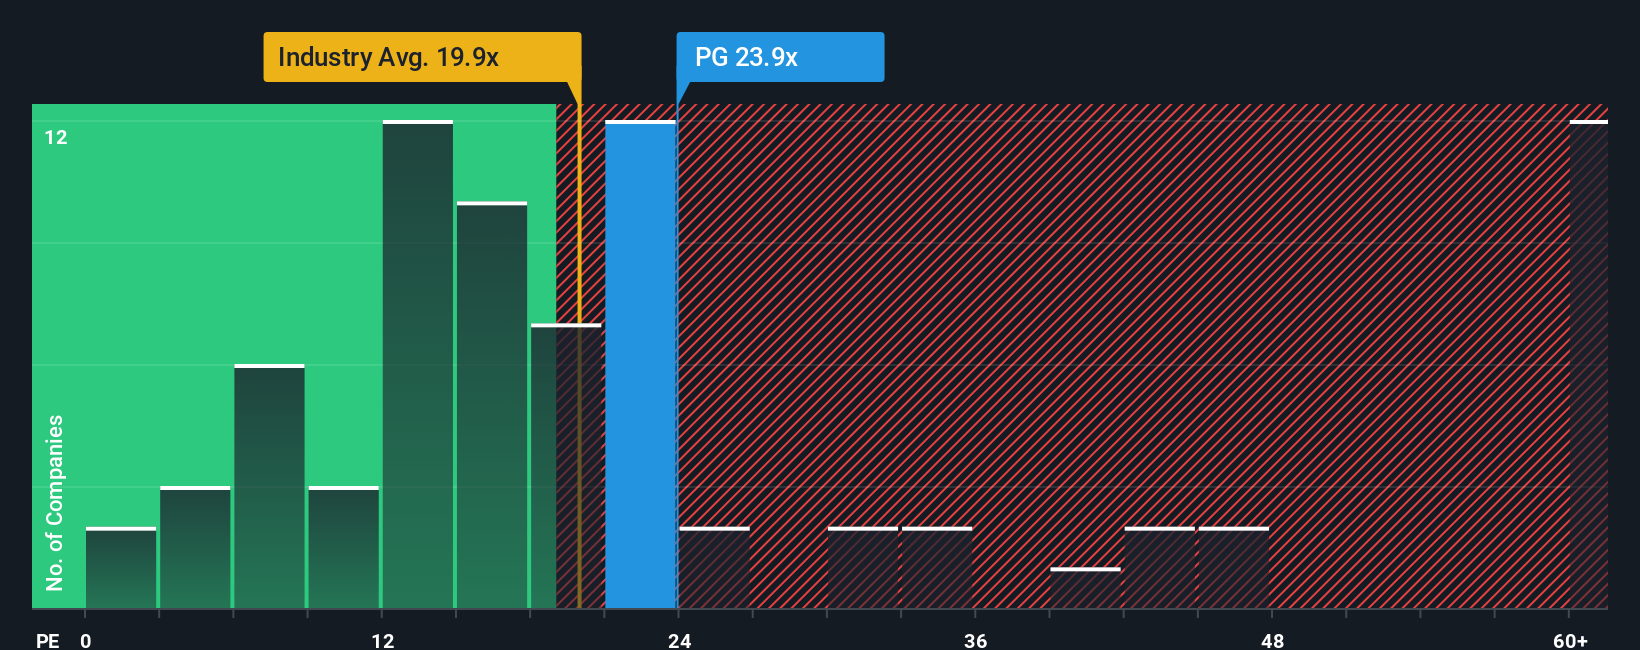
Approach 2: Procter & Gamble Price vs Earnings
The Price-to-Earnings (PE) ratio is a popular valuation metric for profitable companies like Procter & Gamble because it reflects how much investors are willing to pay today for each dollar of current earnings. It is particularly useful when a company has steady profits, as is the case here. The appropriate PE ratio for any company generally depends on its expected earnings growth, risk profile, and how those compare to peers and the broader industry.
Procter & Gamble currently trades on a PE multiple of 22.6x. This is slightly above the Household Products industry average of 19.9x, but sits just below the average of close peers, which is 24.3x. By traditional standards, the stock looks fairly valued relative to the sector and its direct competitors.
However, Simply Wall St introduces a proprietary “Fair Ratio” for PE, designed to pinpoint a more precise benchmark for Procter & Gamble. This Fair Ratio, 27.6x, is calculated specifically based on the company’s earnings growth prospects, profit margins, risk factors, industry dynamics, and market capitalization. Unlike broad industry or peer comparisons, the Fair Ratio delivers a more nuanced and tailored assessment that captures what is truly reasonable for this unique business.
Comparing Procter & Gamble’s actual PE ratio (22.6x) to its Fair Ratio (27.6x), the stock appears to be undervalued using this approach. Investors are currently paying less than what would be considered fair given the company’s fundamentals and outlook.
Result: UNDERVALUED
PE ratios tell one story, but what if the real opportunity lies elsewhere? Discover companies where insiders are betting big on explosive growth.
Upgrade Your Decision Making: Choose your Procter & Gamble Narrative
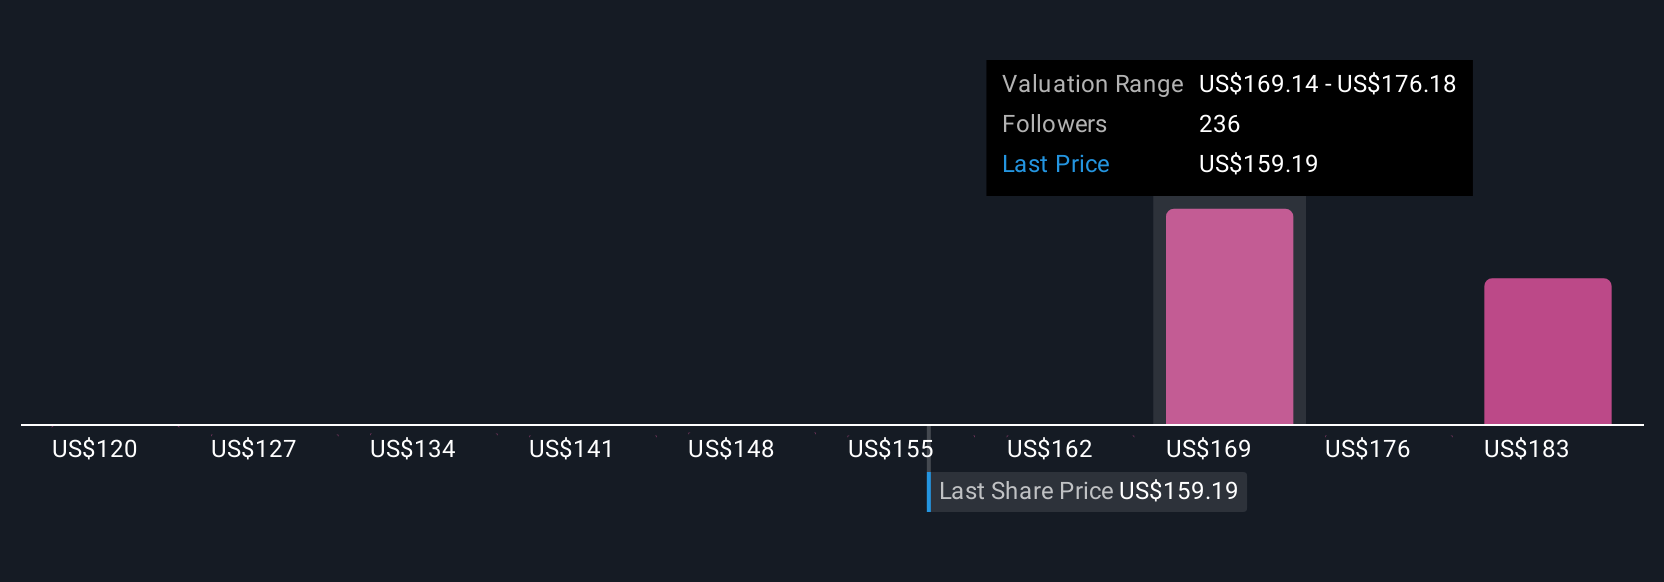
Earlier we mentioned that there is an even better way to understand valuation, so let's introduce you to Narratives. A Narrative is a clear, approachable story you create about a company. It combines your own view of Procter & Gamble’s business future with specific financial forecasts like fair value, future revenue, and margins. This approach directly links the company’s story to a set of numbers, letting you see how your outlook translates into a fair value estimate.
Narratives are a powerful but easy-to-use tool available within the Simply Wall St Community page, trusted by millions of investors. They help you make smarter buy or sell decisions by updating your fair value versus the current share price whenever new data arrives, whether it is fresh news, earnings results, or company developments.
For example, some investors might be cautious and estimate Procter & Gamble’s fair value at $119.81, focusing on mature, slower growth and cautious margins. Others are more optimistic, projecting fair value as high as $168.64 by factoring in stronger innovation, higher profit margins, and increased consumer demand. With Narratives, you can easily explore these different perspectives, stress test your assumptions, and decide exactly which story and price fit your own view best.
For Procter & Gamble, we will make it really easy for you with previews of two leading Procter & Gamble Narratives:
- 🐂 Procter & Gamble Bull Case
Fair value: $168.64
Currently 10.1% below fair value
Expected revenue growth: 3.17%
- Heavy investment in product innovation and improved productivity could boost market share and margins, even as economic conditions fluctuate.
- Analysts expect revenue and earnings growth through 2028, with profit margins rising and shares outstanding reducing slightly each year.
- Risks include consumer volatility, geopolitical tensions, tariffs, and currency fluctuations. However, the consensus sees Procter & Gamble as fairly valued or modestly undervalued for long-term holders.
- 🐻 Procter & Gamble Bear Case
Fair value: $119.81
Currently 26.5% above fair value
Expected revenue growth: 4.68%
- Slowing growth is expected to bring revenue and cash flow increases in line with inflation and the risk-free rate. This could result in limited upside from current levels.
- Valuation methods weighted toward cash flow and dividends suggest the stock is trading well above fair value, at a premium multiple.
- While P&G remains a stable dividend payer with strong brand power, high margins, and efficient operations, investors may be paying too much unless growth or margins exceed expectations.
Do you think there's more to the story for Procter & Gamble? Create your own Narrative to let the Community know!
This article by Simply Wall St is general in nature. We provide commentary based on historical data and analyst forecasts only using an unbiased methodology and our articles are not intended to be financial advice. It does not constitute a recommendation to buy or sell any stock, and does not take account of your objectives, or your financial situation. We aim to bring you long-term focused analysis driven by fundamental data. Note that our analysis may not factor in the latest price-sensitive company announcements or qualitative material. Simply Wall St has no position in any stocks mentioned.
New: Manage All Your Stock Portfolios in One Place
We've created the ultimate portfolio companion for stock investors, and it's free.
• Connect an unlimited number of Portfolios and see your total in one currency
• Be alerted to new Warning Signs or Risks via email or mobile
• Track the Fair Value of your stocks
Have feedback on this article? Concerned about the content? Get in touch with us directly. Alternatively, email editorial-team@simplywallst.com
About NYSE:PG
Outstanding track record established dividend payer.
Similar Companies
Market Insights

Advertisement
Community Narratives
Finding The True Value Of A Logistics Powerhouse
Fair Value US$95.21|7.5% undervalued
NV
Community Contributor
Paradigm Biopharmaceuticals Will Lead Osteoarthritis Treatment with Zilosul's FDA Success
Fair Value AU$5.50|91.8% undervalued
AM
Community Contributor
Barrick Mining (ABX:CA): A Gold Hedge against a U.S. Shutdown
Fair Value CA$60.00|26.4% undervalued
GM
Community Contributor