Stock Analysis
- United States
- /
- Personal Products
- /
- NYSE:NUS
What Is Nu Skin Enterprises's (NYSE:NUS) P/E Ratio After Its Share Price Tanked?


Unfortunately for some shareholders, the Nu Skin Enterprises (NYSE:NUS) share price has dived 31% in the last thirty days. Indeed the recent decline has arguably caused some bitterness for shareholders who have held through the 57% drop over twelve months.
All else being equal, a share price drop should make a stock more attractive to potential investors. In the long term, share prices tend to follow earnings per share, but in the short term prices bounce around in response to short term factors (which are not always obvious). The implication here is that long term investors have an opportunity when expectations of a company are too low. One way to gauge market expectations of a stock is to look at its Price to Earnings Ratio (PE Ratio). A high P/E ratio means that investors have a high expectation about future growth, while a low P/E ratio means they have low expectations about future growth.
View our latest analysis for Nu Skin Enterprises
How Does Nu Skin Enterprises's P/E Ratio Compare To Its Peers?
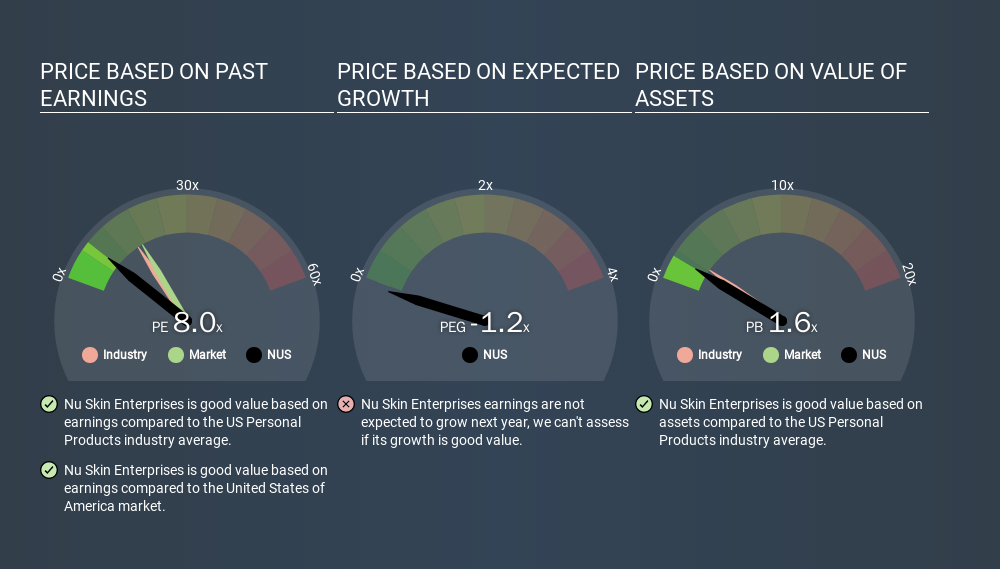
Nu Skin Enterprises's P/E of 7.97 indicates relatively low sentiment towards the stock. We can see in the image below that the average P/E (15.7) for companies in the personal products industry is higher than Nu Skin Enterprises's P/E.
This suggests that market participants think Nu Skin Enterprises will underperform other companies in its industry. Many investors like to buy stocks when the market is pessimistic about their prospects. It is arguably worth checking if insiders are buying shares, because that might imply they believe the stock is undervalued.
How Growth Rates Impact P/E Ratios
Earnings growth rates have a big influence on P/E ratios. If earnings are growing quickly, then the 'E' in the equation will increase faster than it would otherwise. And in that case, the P/E ratio itself will drop rather quickly. A lower P/E should indicate the stock is cheap relative to others -- and that may attract buyers.
Notably, Nu Skin Enterprises grew EPS by a whopping 41% in the last year. And its annual EPS growth rate over 3 years is 6.6%. With that performance, I would expect it to have an above average P/E ratio.
Don't Forget: The P/E Does Not Account For Debt or Bank Deposits
Don't forget that the P/E ratio considers market capitalization. That means it doesn't take debt or cash into account. In theory, a company can lower its future P/E ratio by using cash or debt to invest in growth.
Such spending might be good or bad, overall, but the key point here is that you need to look at debt to understand the P/E ratio in context.
Nu Skin Enterprises's Balance Sheet
Net debt totals just 1.2% of Nu Skin Enterprises's market cap. So it doesn't have as many options as it would with net cash, but its debt would not have much of an impact on its P/E ratio.
The Bottom Line On Nu Skin Enterprises's P/E Ratio
Nu Skin Enterprises trades on a P/E ratio of 8.0, which is below the US market average of 16.6. The EPS growth last year was strong, and debt levels are quite reasonable. If it continues to grow, then the current low P/E may prove to be unjustified. Given Nu Skin Enterprises's P/E ratio has declined from 11.6 to 8.0 in the last month, we know for sure that the market is more worried about the business today, than it was back then. For those who prefer to invest with the flow of momentum, that might be a bad sign, but for deep value investors this stock might justify some research.
When the market is wrong about a stock, it gives savvy investors an opportunity. If the reality for a company is not as bad as the P/E ratio indicates, then the share price should increase as the market realizes this. So this free report on the analyst consensus forecasts could help you make a master move on this stock.
But note: Nu Skin Enterprises may not be the best stock to buy. So take a peek at this free list of interesting companies with strong recent earnings growth (and a P/E ratio below 20).
If you spot an error that warrants correction, please contact the editor at editorial-team@simplywallst.com. This article by Simply Wall St is general in nature. It does not constitute a recommendation to buy or sell any stock, and does not take account of your objectives, or your financial situation. Simply Wall St has no position in the stocks mentioned.
We aim to bring you long-term focused research analysis driven by fundamental data. Note that our analysis may not factor in the latest price-sensitive company announcements or qualitative material. Thank you for reading.
About NYSE:NUS
Nu Skin Enterprises
Engages in the development and distribution of various beauty and wellness products worldwide.
Undervalued with excellent balance sheet.
