

Legendary fund manager Li Lu (who Charlie Munger backed) once said, 'The biggest investment risk is not the volatility of prices, but whether you will suffer a permanent loss of capital.' When we think about how risky a company is, we always like to look at its use of debt, since debt overload can lead to ruin. As with many other companies Stryker Corporation (NYSE:SYK) makes use of debt. But the more important question is: how much risk is that debt creating?
Why Does Debt Bring Risk?
Debt and other liabilities become risky for a business when it cannot easily fulfill those obligations, either with free cash flow or by raising capital at an attractive price. If things get really bad, the lenders can take control of the business. However, a more usual (but still expensive) situation is where a company must dilute shareholders at a cheap share price simply to get debt under control. Of course, plenty of companies use debt to fund growth, without any negative consequences. The first thing to do when considering how much debt a business uses is to look at its cash and debt together.
Our analysis indicates that SYK is potentially undervalued!
What Is Stryker's Debt?
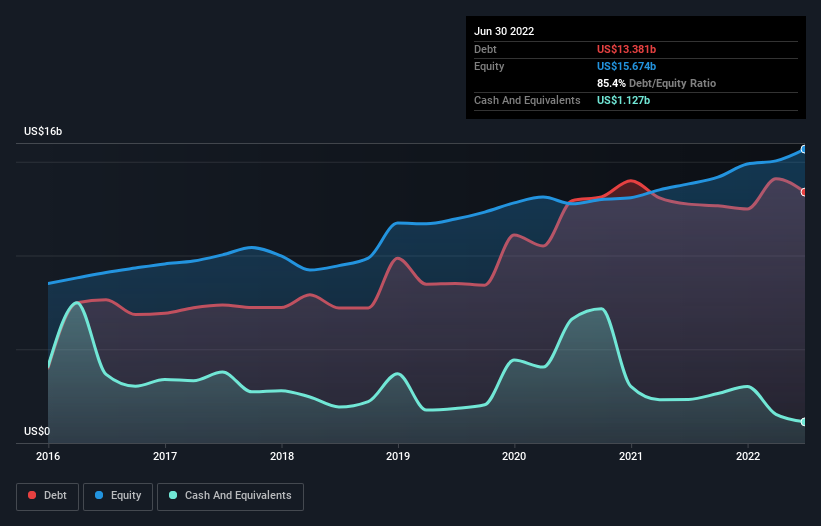
As you can see below, at the end of June 2022, Stryker had US$13.4b of debt, up from US$12.7b a year ago. Click the image for more detail. On the flip side, it has US$1.13b in cash leading to net debt of about US$12.3b.
How Healthy Is Stryker's Balance Sheet?
According to the last reported balance sheet, Stryker had liabilities of US$4.40b due within 12 months, and liabilities of US$16.0b due beyond 12 months. On the other hand, it had cash of US$1.13b and US$3.15b worth of receivables due within a year. So it has liabilities totalling US$16.1b more than its cash and near-term receivables, combined.
Of course, Stryker has a titanic market capitalization of US$86.4b, so these liabilities are probably manageable. Having said that, it's clear that we should continue to monitor its balance sheet, lest it change for the worse.
In order to size up a company's debt relative to its earnings, we calculate its net debt divided by its earnings before interest, tax, depreciation, and amortization (EBITDA) and its earnings before interest and tax (EBIT) divided by its interest expense (its interest cover). This way, we consider both the absolute quantum of the debt, as well as the interest rates paid on it.
Stryker's net debt is 2.7 times its EBITDA, which is a significant but still reasonable amount of leverage. However, its interest coverage of 13.3 is very high, suggesting that the interest expense on the debt is currently quite low. Unfortunately, Stryker saw its EBIT slide 2.9% in the last twelve months. If that earnings trend continues then its debt load will grow heavy like the heart of a polar bear watching its sole cub. There's no doubt that we learn most about debt from the balance sheet. But ultimately the future profitability of the business will decide if Stryker can strengthen its balance sheet over time. So if you want to see what the professionals think, you might find this free report on analyst profit forecasts to be interesting.
Finally, while the tax-man may adore accounting profits, lenders only accept cold hard cash. So the logical step is to look at the proportion of that EBIT that is matched by actual free cash flow. Over the most recent three years, Stryker recorded free cash flow worth 70% of its EBIT, which is around normal, given free cash flow excludes interest and tax. This cold hard cash means it can reduce its debt when it wants to.
Our View
Happily, Stryker's impressive interest cover implies it has the upper hand on its debt. But, on a more sombre note, we are a little concerned by its net debt to EBITDA. It's also worth noting that Stryker is in the Medical Equipment industry, which is often considered to be quite defensive. Looking at all the aforementioned factors together, it strikes us that Stryker can handle its debt fairly comfortably. Of course, while this leverage can enhance returns on equity, it does bring more risk, so it's worth keeping an eye on this one. When analysing debt levels, the balance sheet is the obvious place to start. But ultimately, every company can contain risks that exist outside of the balance sheet. For example, we've discovered 2 warning signs for Stryker (1 is significant!) that you should be aware of before investing here.
Of course, if you're the type of investor who prefers buying stocks without the burden of debt, then don't hesitate to discover our exclusive list of net cash growth stocks, today.
If you're looking to trade Stryker, open an account with the lowest-cost platform trusted by professionals, Interactive Brokers.
With clients in over 200 countries and territories, and access to 160 markets, IBKR lets you trade stocks, options, futures, forex, bonds and funds from a single integrated account.
Enjoy no hidden fees, no account minimums, and FX conversion rates as low as 0.03%, far better than what most brokers offer.
Sponsored ContentNew: Manage All Your Stock Portfolios in One Place
We've created the ultimate portfolio companion for stock investors, and it's free.
• Connect an unlimited number of Portfolios and see your total in one currency
• Be alerted to new Warning Signs or Risks via email or mobile
• Track the Fair Value of your stocks
Have feedback on this article? Concerned about the content? Get in touch with us directly. Alternatively, email editorial-team (at) simplywallst.com.
This article by Simply Wall St is general in nature. We provide commentary based on historical data and analyst forecasts only using an unbiased methodology and our articles are not intended to be financial advice. It does not constitute a recommendation to buy or sell any stock, and does not take account of your objectives, or your financial situation. We aim to bring you long-term focused analysis driven by fundamental data. Note that our analysis may not factor in the latest price-sensitive company announcements or qualitative material. Simply Wall St has no position in any stocks mentioned.
About NYSE:SYK
Average dividend payer with moderate growth potential.
Similar Companies
Market Insights

Community Narratives

