Advertisement
- United States
- /
- Medical Equipment
- /
- NYSE:SYK
Should Investors Rethink Stryker Valuation After Strong Q1 Revenue Beat?

Simply Wall St
Reviewed by Bailey Pemberton
Trying to decide what to do with Stryker stock right now? You are not alone. Whether you are an investor keeping an eye out for the next winning healthcare name or just curious about this medtech giant, there is plenty happening beneath the surface. Stryker’s share price has seen its fair share of movement lately, rising 2.6% over the past week, holding fairly steady over the last month, and working its way up 4.4% so far this year. If you zoom out a bit, the stock’s strength becomes even clearer, having climbed an impressive 74.9% over the past three years and 83.6% over five years.
What is driving these moves? Recent sector shifts in healthcare and growing optimism about medical devices have certainly played a part, fueling renewed interest from both existing and new investors. This kind of momentum puts Stryker on a lot of watchlists. But when it comes to investing, excitement only gets you so far. The real question is whether the stock is trading at a fair price.
Looking at the numbers, Stryker is currently undervalued in just one of six standard valuation checks, giving it a value score of 1. That might sound underwhelming, but numbers only tell part of the story. Next, we will unpack these valuation methods. Stick around, because there may be a smarter way to size up Stryker’s true worth.
Stryker scores just 1/6 on our valuation checks. See what other red flags we found in the full valuation breakdown.
Approach 1: Stryker Discounted Cash Flow (DCF) Analysis
A Discounted Cash Flow (DCF) model estimates a company’s value by projecting its expected future cash flows and then discounting them back to their present value. This approach aims to capture the true underlying worth of a business by focusing on the cash it generates, rather than just reported earnings.
For Stryker, the DCF uses a two-stage Free Cash Flow to Equity model. The company’s current Free Cash Flow stands at approximately $4.04 billion. Analysts have issued explicit cash flow forecasts for the next five years, during which Stryker’s Free Cash Flow is expected to keep growing, from $4.46 billion by 2026 up to $6.37 billion by 2028. Further out, estimates rely on extrapolation, with Simply Wall St projecting Stryker’s Free Cash Flow to reach over $10.3 billion by 2035, reflecting consistent annual growth in the intervening years.
Based on these projections, the intrinsic value for Stryker’s shares works out to about $425.12. This means Stryker’s stock is currently trading at an 11.9% discount to its estimated fair value, which implies that shares are undervalued according to this model.
Result: UNDERVALUED
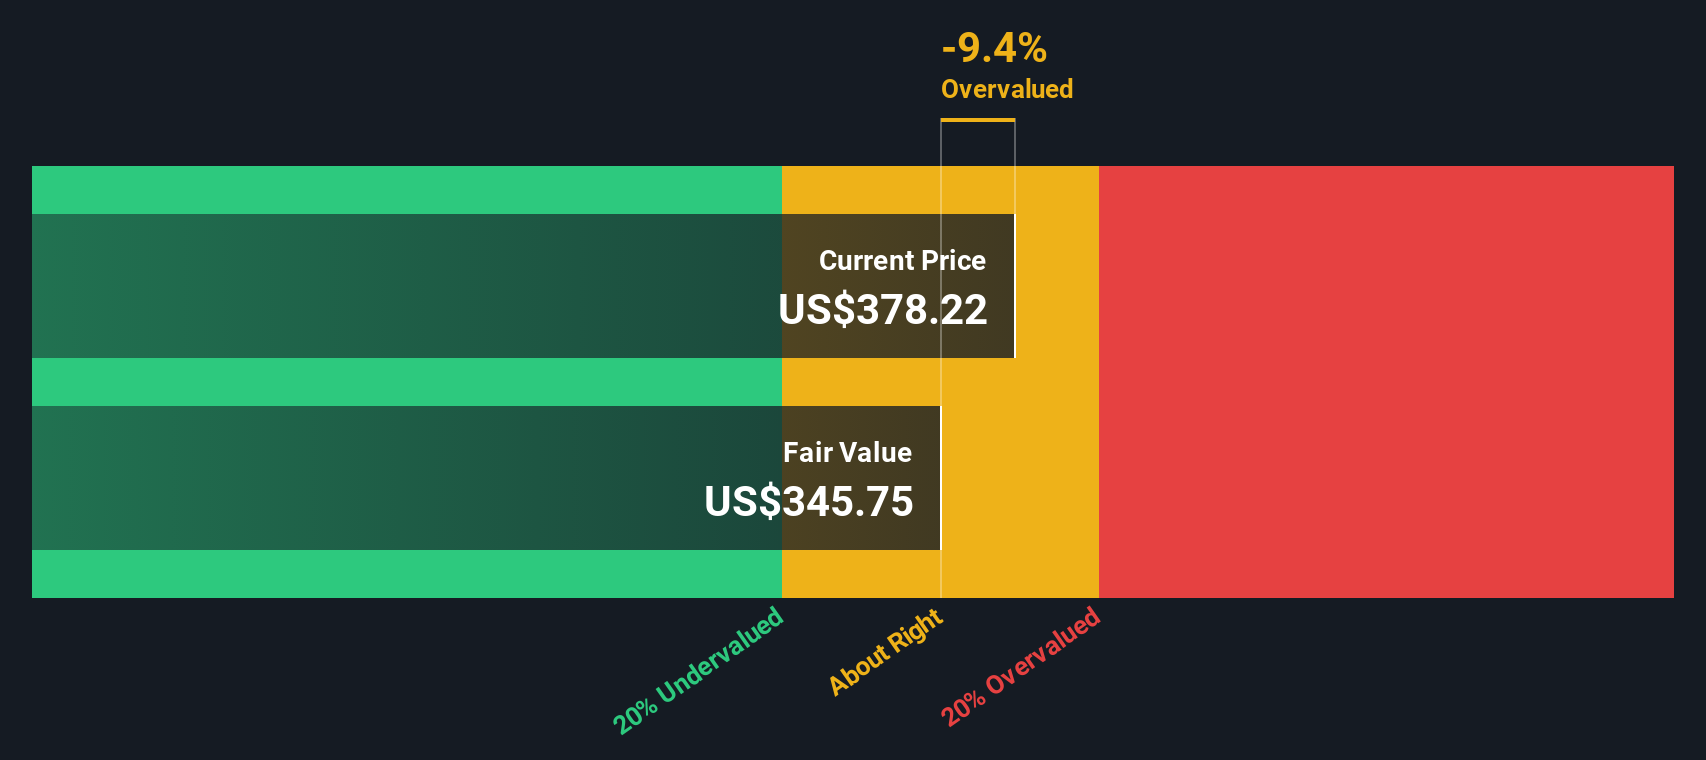
Our Discounted Cash Flow (DCF) analysis suggests Stryker is undervalued by 11.9%. Track this in your watchlist or portfolio, or discover more undervalued stocks.
Approach 2: Stryker Price vs Earnings (PE Ratio)
The price-to-earnings (PE) ratio is a widely used valuation tool for profitable companies because it relates the company’s share price to its actual underlying earnings. This offers insight into how much investors are willing to pay for a dollar of profit. For established, steadily growing businesses like Stryker, the PE ratio can be particularly telling, as it reflects market expectations of growth and the level of risk investors are willing to assume. Typically, higher growth prospects or lower perceived risks justify a higher PE ratio, while slower growth or more uncertainty should lead to a lower ratio.
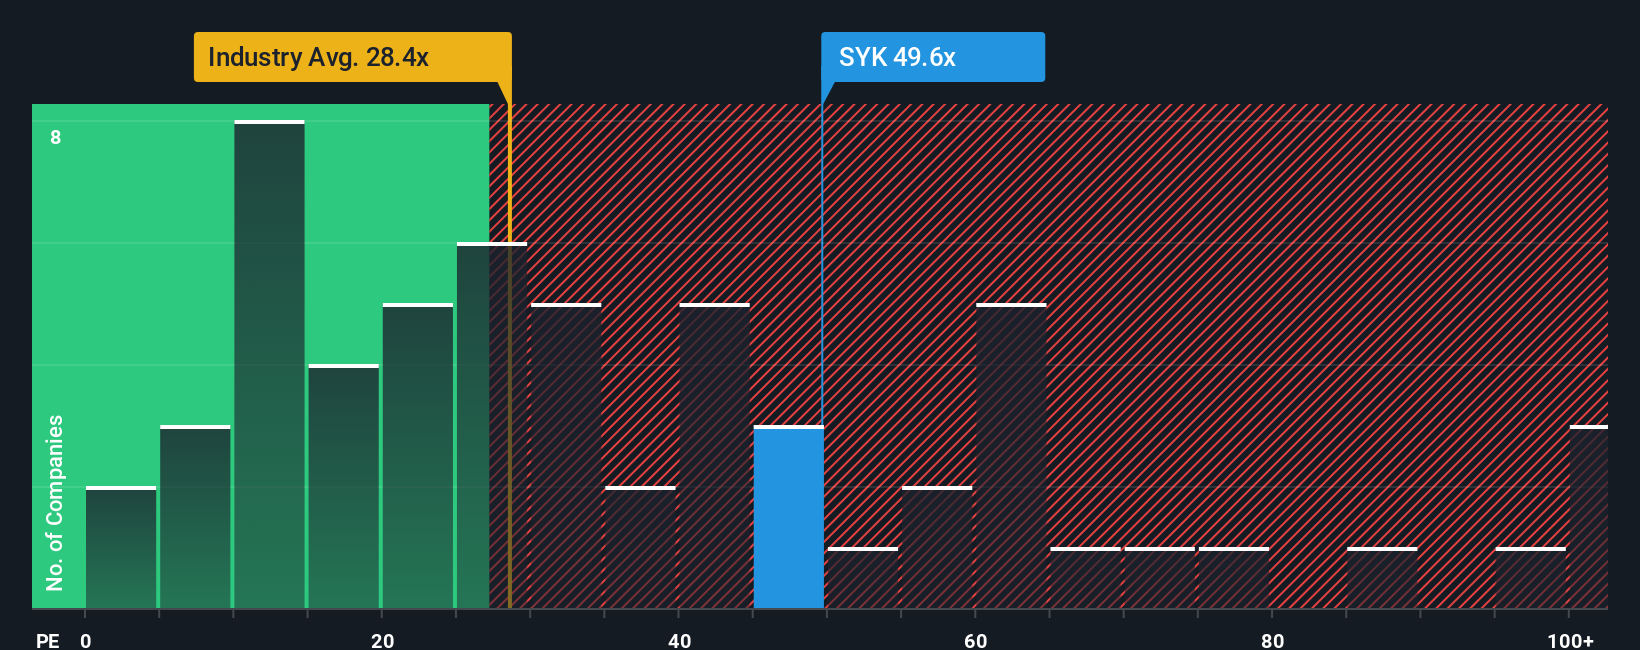
Currently, Stryker trades at a PE ratio of 49.1x. For context, the average PE for the broader medical equipment industry sits at 29.1x, while the average for Stryker’s closest peers is 40.6x. At first glance, Stryker’s valuation premium signals that investors are paying up for either strong growth potential or a unique advantage.
This is where Simply Wall St’s "Fair Ratio" comes in. Unlike basic industry or peer comparisons, the Fair Ratio is calculated at 33.7x for Stryker and considers the company’s specific growth forecast, margin profile, market cap, and risk, providing a more tailored benchmark. It is a smarter yardstick because it acknowledges what makes Stryker different from both generic industry players and its direct peers.
Comparing the Fair Ratio to Stryker’s actual PE, the current multiple is notably higher than what would be justified given its fundamentals. This suggests the stock is trading above its fair value based on earnings-driven metrics alone.
Result: OVERVALUED
PE ratios tell one story, but what if the real opportunity lies elsewhere? Discover companies where insiders are betting big on explosive growth.
Upgrade Your Decision Making: Choose your Stryker Narrative
Earlier we mentioned that there is an even better way to understand valuation, so let’s introduce you to Narratives. A Narrative is simply the story behind the numbers — your perspective on Stryker, shaped by what you think about its future revenue, margins, and fair value. Instead of relying solely on past data or generic ratios, Narratives let you connect the company's big-picture story to a detailed financial forecast and ultimately to its estimated value.
On Simply Wall St’s Community page, millions of investors use Narratives as an accessible tool to build their own valuation stories, compare them, and see how their logic stacks up against others. Narratives help you decide when to buy or sell by showing if your estimated Fair Value is above or below the current Price, letting you make decisions rooted in your outlook, not just the crowd’s. They are kept up to date automatically as new news or earnings are released, so your view always reflects the latest market realities.
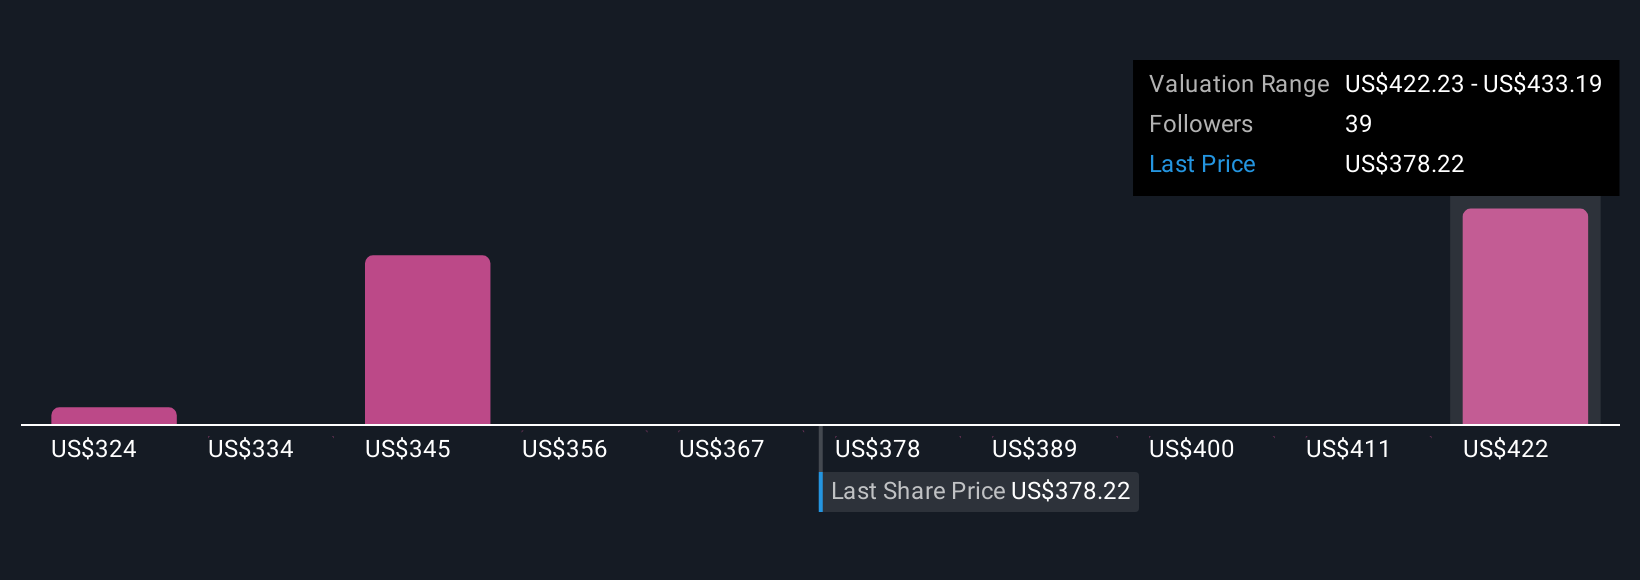
For example, among those analyzing Stryker, some investors expect revenue growth to outpace the industry and target a bullish fair value of $465.0. Others see more risks and peg fair value as low as $316.0, making it easy to see how perspectives and decisions can differ in a single glance.
Do you think there's more to the story for Stryker? Create your own Narrative to let the Community know!
This article by Simply Wall St is general in nature. We provide commentary based on historical data and analyst forecasts only using an unbiased methodology and our articles are not intended to be financial advice. It does not constitute a recommendation to buy or sell any stock, and does not take account of your objectives, or your financial situation. We aim to bring you long-term focused analysis driven by fundamental data. Note that our analysis may not factor in the latest price-sensitive company announcements or qualitative material. Simply Wall St has no position in any stocks mentioned.
New: Manage All Your Stock Portfolios in One Place
We've created the ultimate portfolio companion for stock investors, and it's free.
• Connect an unlimited number of Portfolios and see your total in one currency
• Be alerted to new Warning Signs or Risks via email or mobile
• Track the Fair Value of your stocks
Have feedback on this article? Concerned about the content? Get in touch with us directly. Alternatively, email editorial-team@simplywallst.com
About NYSE:SYK
Adequate balance sheet average dividend payer.
Similar Companies
Market Insights

Advertisement
Community Narratives
Kodiak AI - a potential 100 bagger opportunity?
Fair Value US$14.00|44.7% undervalued
DA
Community Contributor
A Fair Price for a Great Business Facing Real Threats
Fair Value US$383.06|13.0% undervalued
IM
Community Contributor
AXON And Shopify Integration Will Unlock Global Mobile Advertising
Fair Value US$646.30|7.3% undervalued
AN
Based on Analyst Price Targets