Advertisement
- United States
- /
- Medical Equipment
- /
- NYSE:SYK
Assessing Stryker's Value After New Surgical Robotics Launch in 2025

Simply Wall St
Reviewed by Bailey Pemberton
If you’re checking out Stryker stock and weighing your next move, you’re definitely not alone. The stock price has been on a bit of a journey lately, with only a slight uptick of 0.4% over the past week but a slight pullback of 4.6% in the last month. Year-to-date, though, Stryker is up 3.3%. If you zoom out further, the stock’s five-year climb of 75% (and an impressive 83% over three years) really turns heads. These numbers tell a story of steady growth, but they also leave plenty of investors wondering if we are looking at a fair price right now, or if there is still room to run.
The recent market landscape, particularly shifts in the broader healthcare sector and investor appetite for medical technology, continue to factor into Stryker’s valuation. Despite robust long-term gains, the stock hasn’t moved aggressively in the short term. This suggests that investors may be cautiously reassessing risk and reward at the moment.
Looking through the lens of valuation, Stryker currently scores 1 out of 6 on our value checks. This means it is only considered undervalued in one of the metrics we track. That is not the highest mark, and it is the sort of figure that should make any smart investor pause and ask questions.
So, how exactly do we break down Stryker’s valuation and what are the classic approaches investors use? In the next section, I will walk you through the main valuation checks. Stay tuned, because at the end of the article, we will talk about a fresh perspective that might give you an even clearer picture of what Stryker is really worth in today’s market.
Stryker scores just 1/6 on our valuation checks. See what other red flags we found in the full valuation breakdown.
Approach 1: Stryker Discounted Cash Flow (DCF) Analysis
The Discounted Cash Flow (DCF) model is a classic approach to determine the intrinsic value of a company. In essence, a DCF projects Stryker's future cash flows into the years ahead and then discounts them back to today’s dollars, reflecting both growth expectations and some built-in caution around risk. This model helps investors cut through short-term noise in the market and focus on the company’s ability to generate cash over time.
Let’s start with Stryker’s current Free Cash Flow, which stands at approximately $4.0 Billion. Using analyst forecasts, this figure is expected to grow meaningfully over the coming years. By 2028, Stryker’s Free Cash Flow is projected to reach about $6.4 Billion. Beyond that, Simply Wall St extrapolates the trend. By 2035, cash flows could rise above $10 Billion if growth holds up.
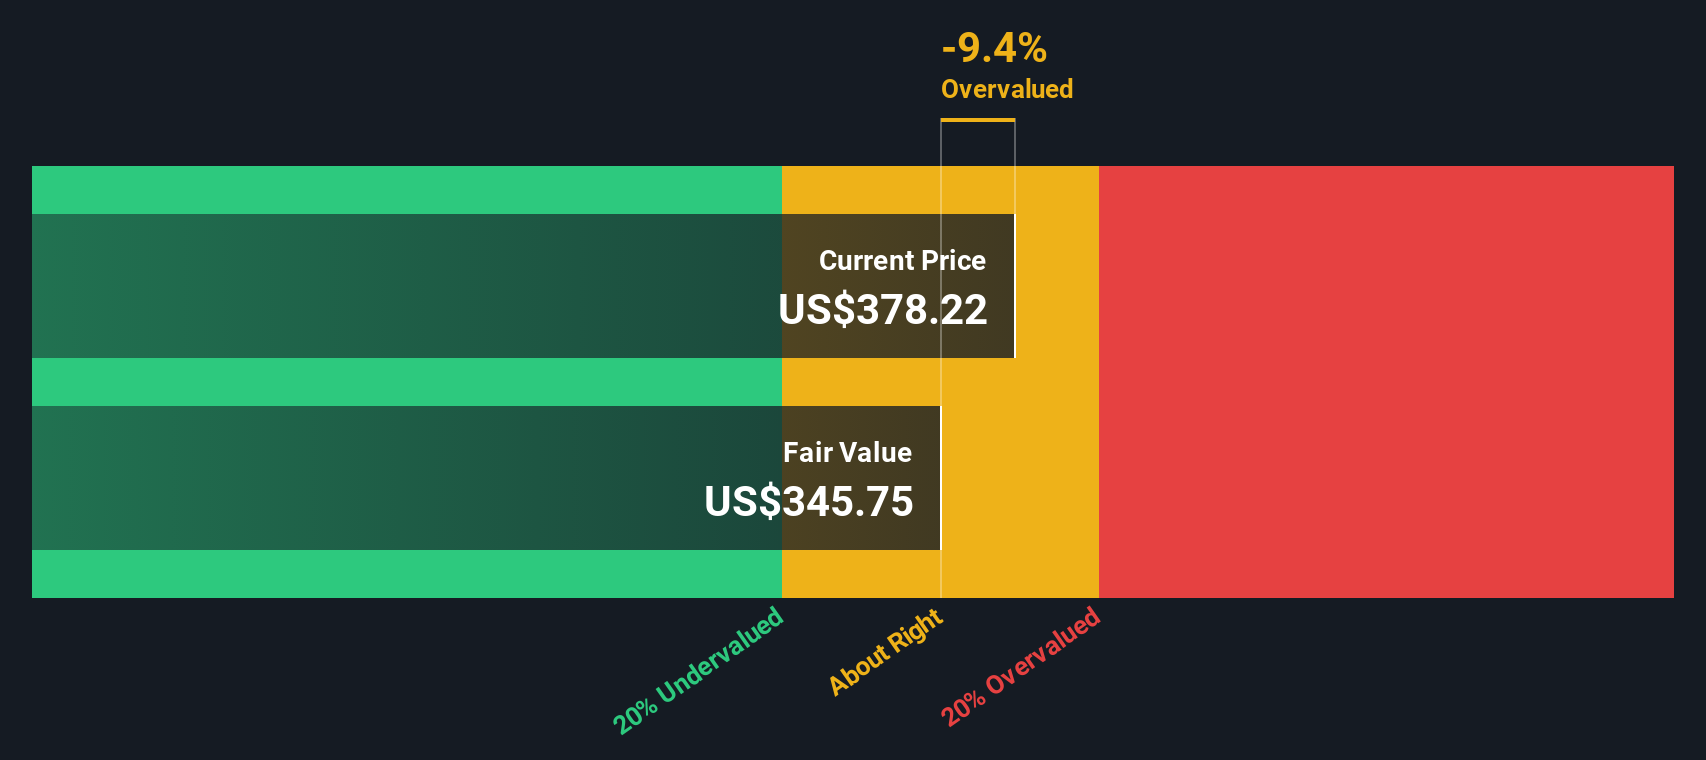
Based on these detailed cash flow projections, the DCF model estimates Stryker’s fair value to be $425 per share. With the current share price trading at a 12.8% discount to this fair value, the numbers suggest that the stock is undervalued at today’s levels.
Result: UNDERVALUED
Our Discounted Cash Flow (DCF) analysis suggests Stryker is undervalued by 12.8%. Track this in your watchlist or portfolio, or discover more undervalued stocks.
Approach 2: Stryker Price vs Earnings (P/E)
The Price-to-Earnings (P/E) ratio is often the go-to metric for valuing established, profitable companies like Stryker. Since profits are the bottom line for any business, the P/E ratio quickly shows how much investors are willing to pay for each dollar of earnings. It is especially useful because it captures the collective sentiment about the company’s current profitability and future prospects.
Growth expectations and perceived risk levels both play significant roles in determining what qualifies as a “normal” or “fair” P/E. Companies with higher growth potential and lower risks typically justify higher P/E ratios. More uncertainty or slower growth tends to pull P/Es down. Striking a balance is key, and that is where comparative benchmarks come in.
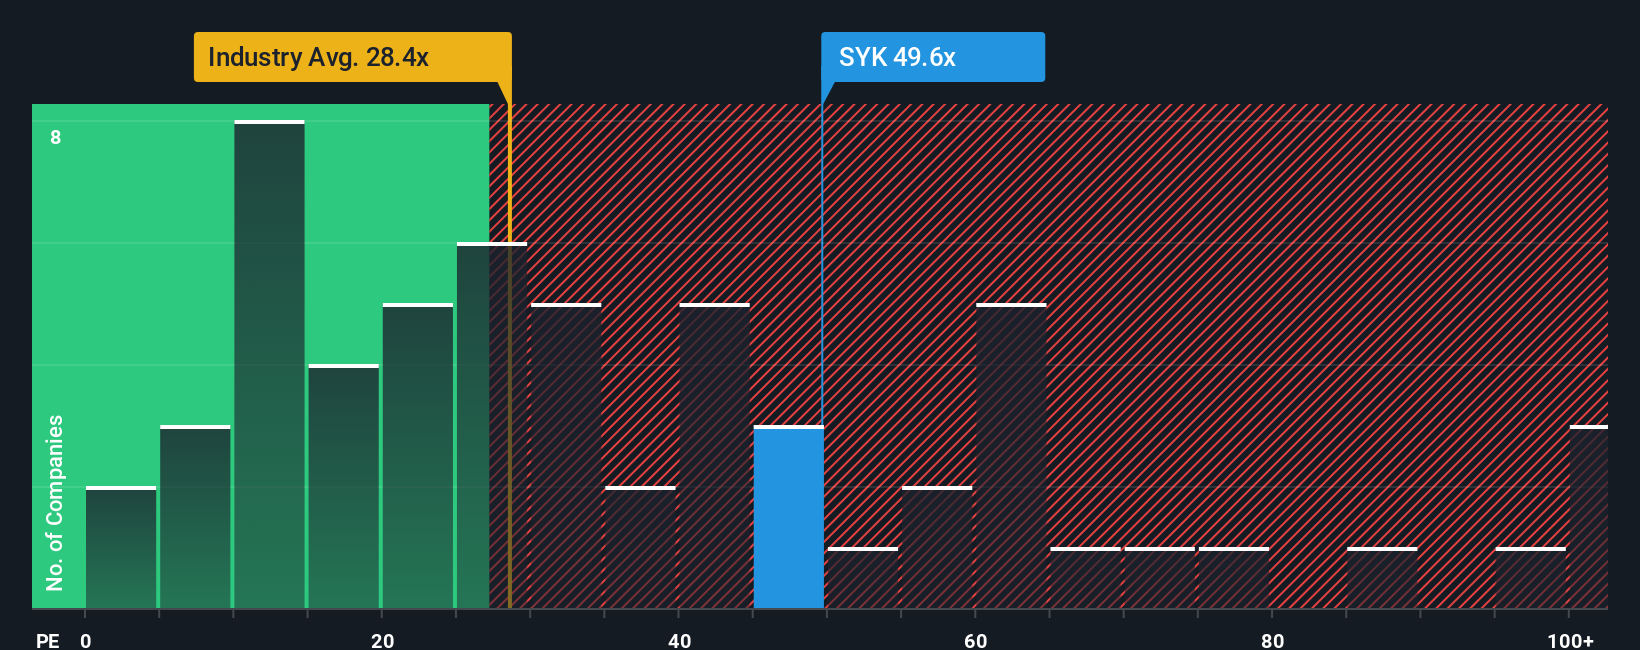
Stryker’s current P/E sits at 48.5x. For context, the average P/E across Stryker’s industry peers is 40.9x, and the broader Medical Equipment industry sits even lower at 31.1x. This suggests that the market currently prices Stryker with a premium, likely reflecting confidence in its growth and financial health. However, Simply Wall St takes this further with the proprietary “Fair Ratio” calculation. The Fair Ratio for Stryker is 33.6x, a figure that weighs up not just broad industry and peer averages, but also Stryker’s specific earnings growth, profit margins, risks, and market cap. This makes it a more nuanced benchmark than simply stacking Stryker up against generic industry figures.
With Stryker’s P/E of 48.5x well above the Fair Ratio of 33.6x, the analysis points to the shares being overvalued based on this metric at current levels.
Result: OVERVALUED
PE ratios tell one story, but what if the real opportunity lies elsewhere? Discover companies where insiders are betting big on explosive growth.
Upgrade Your Decision Making: Choose your Stryker Narrative
Earlier we mentioned there is a smarter way to understand valuation, and that is through Narratives. A Narrative is simply your story about a company. It connects your perspective on Stryker’s strengths, risks, and growth drivers with numbers like future revenue, earnings, and margins. Narratives bridge the gap between what you believe will happen and how that turns into a fair value estimate.
Available right now in Simply Wall St’s Community page, Narratives are easy to use and let you document your view, project your own assumptions, and instantly see how these translate into a fair share price. This helps you make clearer buy or sell decisions by comparing each Narrative’s fair value with the current market price.
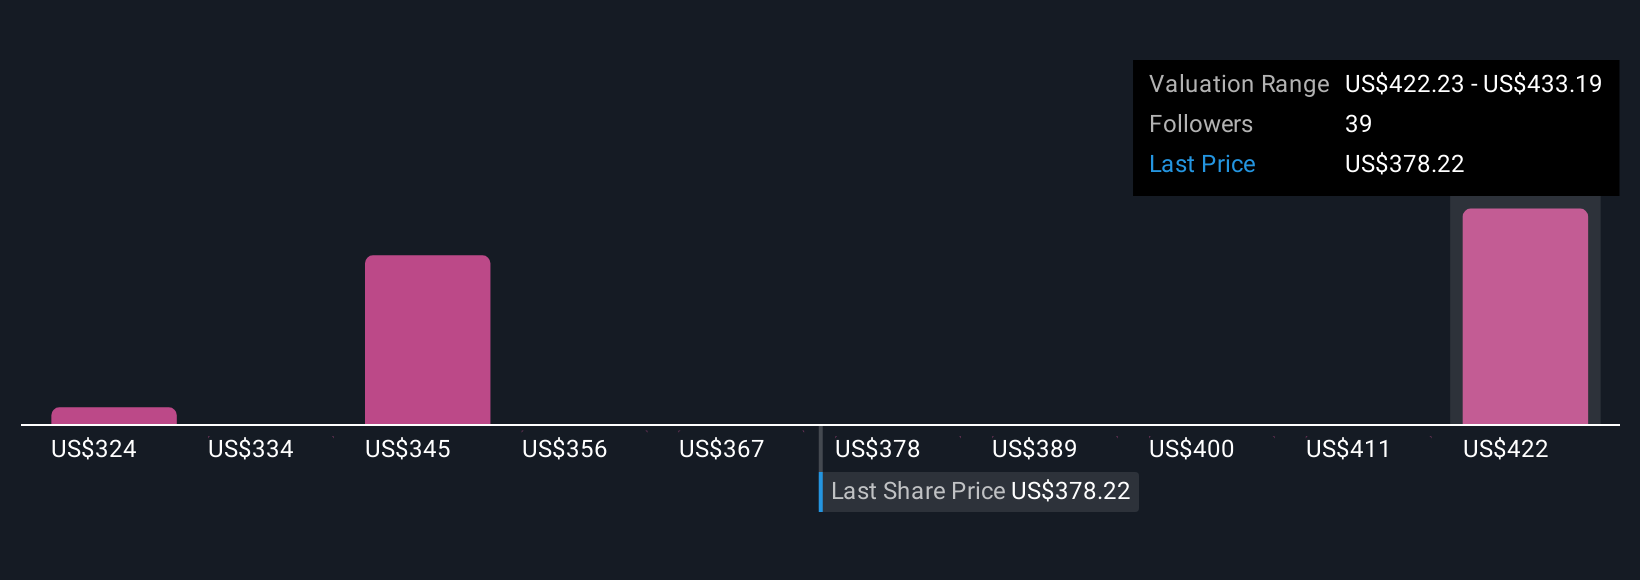
Best of all, Narratives update dynamically. Whenever new news or earnings are released, your assumptions and fair value can be refreshed on the spot, keeping you in sync with the latest information. For Stryker, for example, some investors see powerful tailwinds from aging populations and innovation fueling growth and set a Narrative-based fair value above $460, while more cautious users account for margin risks and assign a fair value closer to $316.
Do you think there's more to the story for Stryker? Create your own Narrative to let the Community know!
This article by Simply Wall St is general in nature. We provide commentary based on historical data and analyst forecasts only using an unbiased methodology and our articles are not intended to be financial advice. It does not constitute a recommendation to buy or sell any stock, and does not take account of your objectives, or your financial situation. We aim to bring you long-term focused analysis driven by fundamental data. Note that our analysis may not factor in the latest price-sensitive company announcements or qualitative material. Simply Wall St has no position in any stocks mentioned.
New: Manage All Your Stock Portfolios in One Place
We've created the ultimate portfolio companion for stock investors, and it's free.
• Connect an unlimited number of Portfolios and see your total in one currency
• Be alerted to new Warning Signs or Risks via email or mobile
• Track the Fair Value of your stocks
Have feedback on this article? Concerned about the content? Get in touch with us directly. Alternatively, email editorial-team@simplywallst.com
About NYSE:SYK
Adequate balance sheet average dividend payer.
Similar Companies
Market Insights

Advertisement
Community Narratives
The Next Phase of Energy Storage: How NeoVolta Is Tackling America’s Power Crunch
Fair Value US$7.50|35.1% undervalued
MA
Community Contributor
Why EnSilica is Worth Possibly 13x its Current Price
Fair Value UK£5.00|89.8% undervalued
DO
Community Contributor
M&A Activity, Industry Diversification & A Defense Contract Monopoly Will Push BWXT For Healthy Long-Term Growth
Fair Value US$220.00|15.2% undervalued
CL
Community Contributor
A case for Cassiar Gold Corp (TSXV: GLDC) to reach CAD$8-10 before 2030 (X30-37)
Fair Value CA$10.00|96.0% undervalued
AG
Community Contributor