Advertisement
- United States
- /
- Healthcare Services
- /
- NYSE:HCA
Assessing HCA Healthcare Value After Major Expansion and 57% Year-to-Date Rally

Simply Wall St
Reviewed by Bailey Pemberton
If you’re holding HCA Healthcare stock or considering jumping in, you’re far from alone. After a week pushing up 8.0%, and a leap of 57.1% since the start of the year, investors everywhere are asking the same question: is this healthcare powerhouse still undervalued, or has the easy money already been made? The answer depends on how you look at valuation, but recent market moves make it clear that confidence in HCA is running high, especially after news about the company’s expansion into new regional markets and its steady track record of strategic acquisitions. Over the past 3 years, those who stayed on board have enjoyed a 120.6% return, and over 5 years, an eye-popping 273.5% gain.
These numbers get more interesting when you consider that our most recent assessment gives HCA a robust value score of 5 out of 6. This means the company is undervalued by nearly every check we use. That’s not something you see every day with a stock displaying returns like these. In a market often obsessed with quick trades and hype, HCA’s story is as much about persistent strength as it is about price appreciation. So, let’s dig into how HCA looks using common valuation methods, before I share what I think is an even smarter way to understand this stock’s true value.
Approach 1: HCA Healthcare Discounted Cash Flow (DCF) Analysis
A Discounted Cash Flow (DCF) model estimates a company’s true worth by projecting its future cash flows and discounting them back to today’s value. This method provides a clearer view of a business’s intrinsic value, beyond just market hype or short-term movements.
For HCA Healthcare, the most recent reported Free Cash Flow (FCF) stands at $7.67 billion, an impressive figure in itself. Analysts forecast FCF rising modestly in the near term. By 2029, Simply Wall St estimates it will reach $7.74 billion. While analyst estimates only go out five years, numbers beyond that are extrapolated, and projections continue to show steady growth, reaching around $9.26 billion by 2035.
Based on these cash flow projections, the DCF model calculates HCA’s intrinsic value at $815.34 per share. With HCA trading at a 42.6% discount to this value, the model strongly indicates the stock is undervalued at current prices.
Bottom line: even after a strong run, HCA Healthcare’s fundamentals and future cash flow growth, as modeled by DCF, point to significant potential upside.
Result: UNDERVALUED
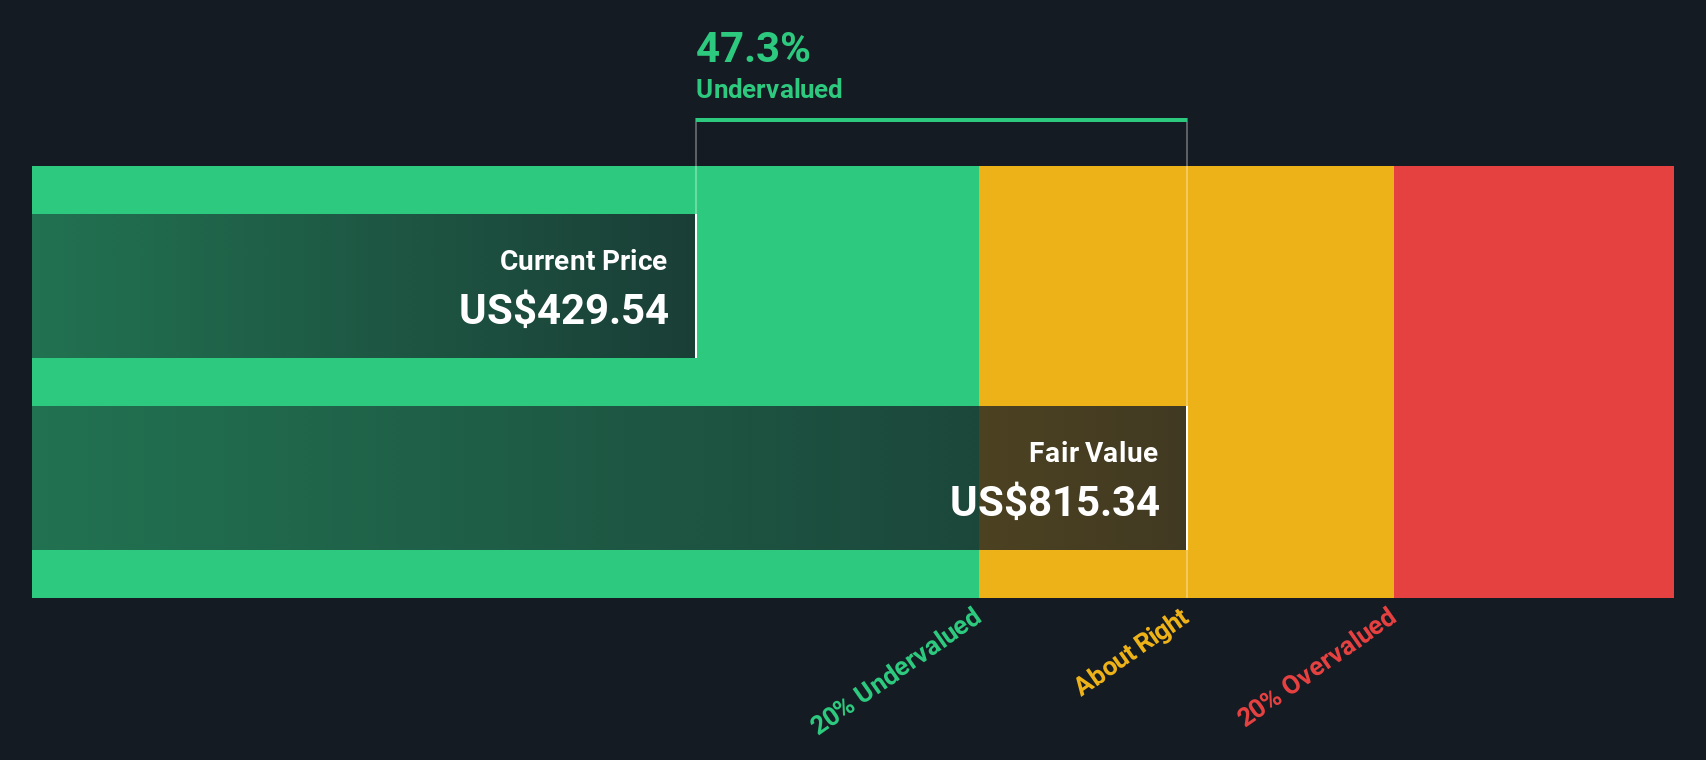
Our Discounted Cash Flow (DCF) analysis suggests HCA Healthcare is undervalued by 42.6%. Track this in your watchlist or portfolio, or discover more undervalued stocks.
Approach 2: HCA Healthcare Price vs Earnings
For established, profitable companies like HCA Healthcare, the Price-to-Earnings (PE) ratio is a trusted benchmark for valuing the stock. The PE ratio allows investors to see how much they are paying for each dollar of a company's earnings, making it a practical metric for businesses with strong and predictable profits.
The level at which a PE ratio is considered "normal" or "fair" depends on factors like a company's future earnings growth, the stability of those earnings, and risks specific to both the business and the wider market. Higher expected growth or lower risk can justify a higher PE, while slower growth or more uncertainty tend to pull the PE down.
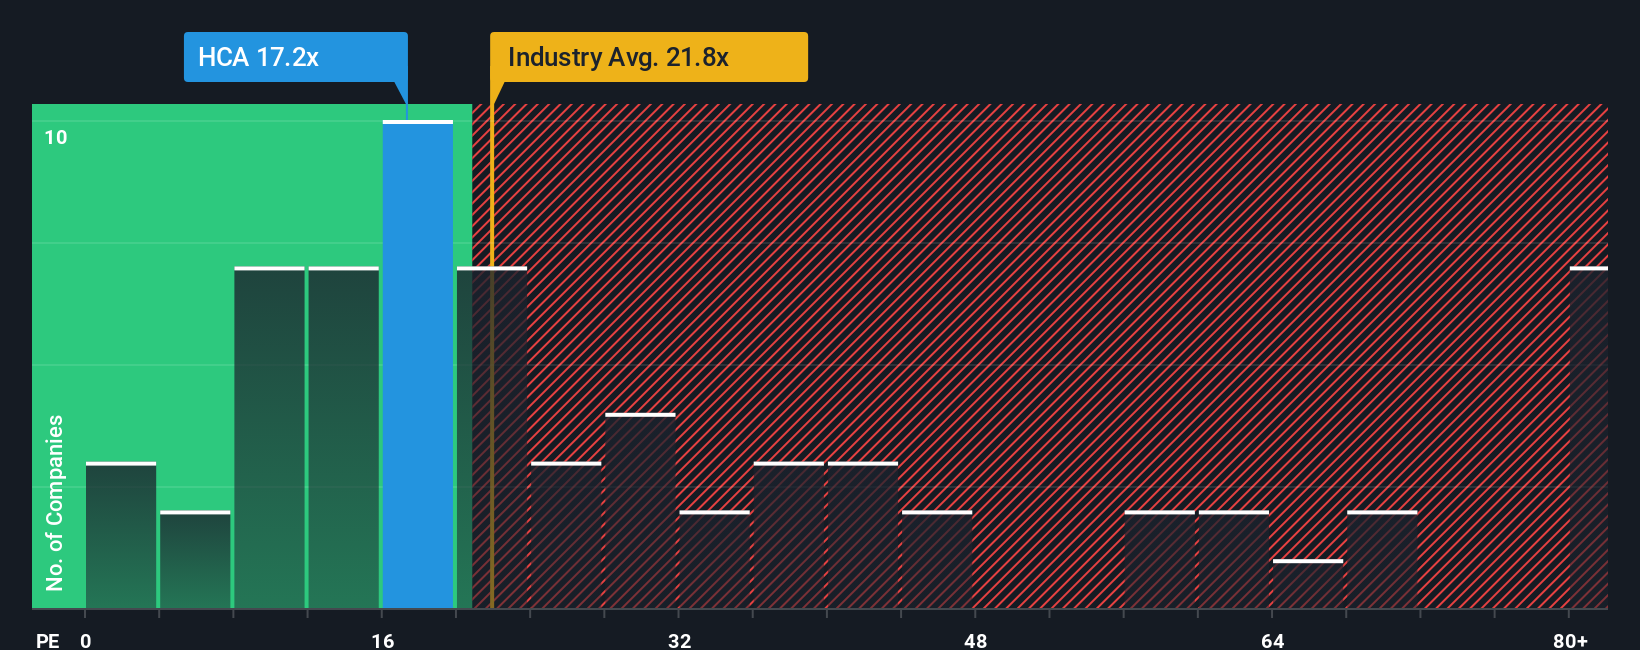
At present, HCA Healthcare trades on a PE of 17.3x. This sits below both the industry average of 21.6x and its peer group at 20.3x. This suggests HCA may be undervalued on a pure comparison basis. However, peer and industry comparisons do not reflect all of the company's unique characteristics.
This is where Simply Wall St's "Fair Ratio" steps in. The Fair Ratio for HCA is calculated at 26.8x, incorporating not just industry benchmarks, but also the company's earnings growth outlook, profit margins, risk profile, and market cap. This approach offers a more nuanced, company-specific view compared to relying solely on broad industry averages or peer multiples.
Comparing HCA’s actual PE of 17.3x with its Fair Ratio of 26.8x, the share price appears to offer a significant margin of value, further supporting the idea that the stock is undervalued at current levels.
Result: UNDERVALUED
PE ratios tell one story, but what if the real opportunity lies elsewhere? Discover companies where insiders are betting big on explosive growth.
Upgrade Your Decision Making: Choose your HCA Healthcare Narrative
Earlier we mentioned that there's an even better way to understand valuation, so let's introduce you to Narratives. A Narrative is a simple yet powerful tool that lets you tell the story behind your investment view, connecting what you believe about HCA Healthcare’s future (such as revenue, earnings, and fair value estimates) with hard numbers. By blending this story with a financial forecast and a calculated fair value, Narratives move beyond one-size-fits-all models to give you a more tailored edge.
On Simply Wall St’s Community page, investors can build and share Narratives quickly, making this approach accessible for anyone, not just financial professionals. Narratives update in real time as new news or earnings are released, helping you stay on top of fresh developments and re-evaluate instantly. You can spot opportunities by comparing each Narrative’s up-to-date Fair Value with HCA’s current price, making your buy or sell decision less about gut feeling and more about informed conviction.
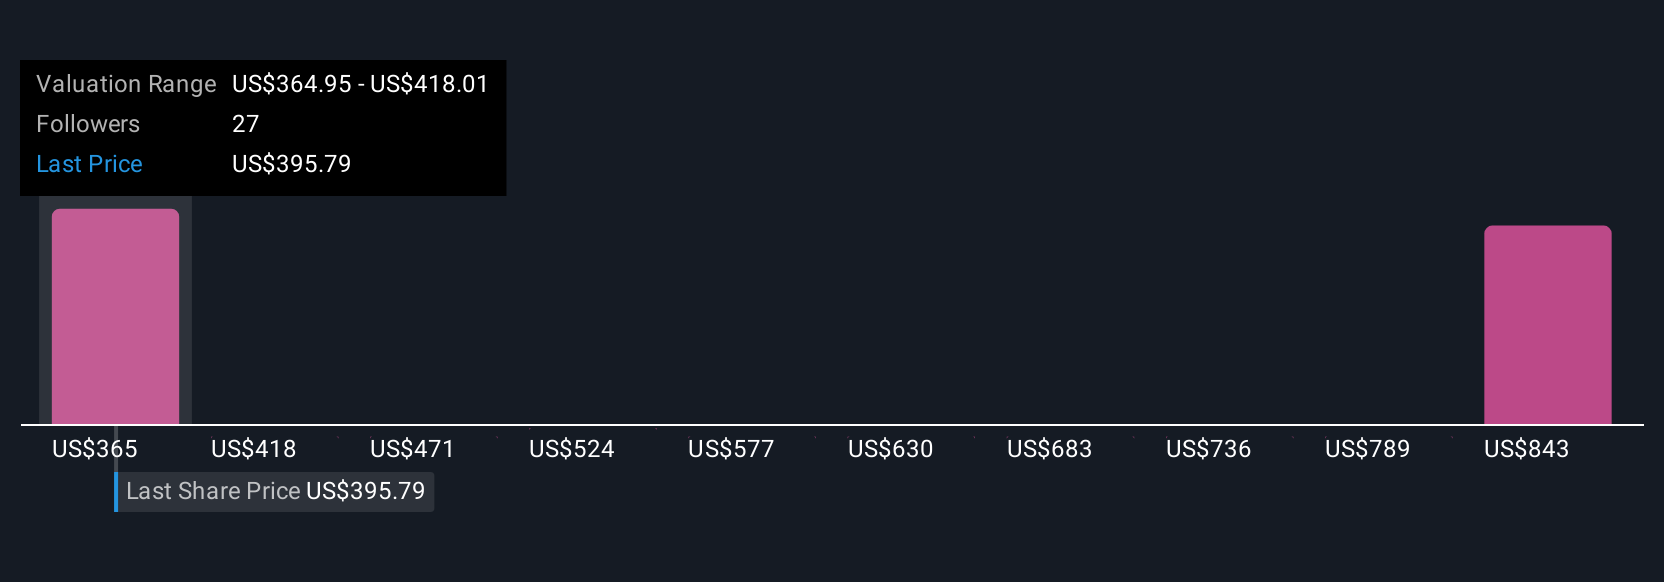
For example, some investors believe HCA’s aggressive expansion will drive the price as high as $449.0 per share. Others, factoring in industry risks and regulatory concerns, see fair value closer to $333.0. With Narratives, you can weigh these perspectives, or create your own, and invest with much greater clarity.
Do you think there's more to the story for HCA Healthcare? Create your own Narrative to let the Community know!
This article by Simply Wall St is general in nature. We provide commentary based on historical data and analyst forecasts only using an unbiased methodology and our articles are not intended to be financial advice. It does not constitute a recommendation to buy or sell any stock, and does not take account of your objectives, or your financial situation. We aim to bring you long-term focused analysis driven by fundamental data. Note that our analysis may not factor in the latest price-sensitive company announcements or qualitative material. Simply Wall St has no position in any stocks mentioned.
Valuation is complex, but we're here to simplify it.
Discover if HCA Healthcare might be undervalued or overvalued with our detailed analysis, featuring fair value estimates, potential risks, dividends, insider trades, and its financial condition.
Access Free AnalysisHave feedback on this article? Concerned about the content? Get in touch with us directly. Alternatively, email editorial-team@simplywallst.com
About NYSE:HCA
HCA Healthcare
Through its subsidiaries, owns and operates hospitals and related healthcare entities in the United States.
Undervalued with proven track record.
Similar Companies
Market Insights

Advertisement
Community Narratives
The company that turned a verb into a global necessity and basically runs the modern internet, digital ads, smartphones, maps, and AI.
Fair Value US$300.00|10.2% undervalued
OS
Community Contributor
Flowers Foods Pays A Fair Price For Health
Fair Value US$16.12|20.3% undervalued
NV
Community Contributor
TMX Group will thrive with 33.3% profit margin and enduring market moat
Fair Value CA$49.90|0.1% undervalued
LI
Community Contributor