- United States
- /
- Healthcare Services
- /
- OTCPK:ATIP
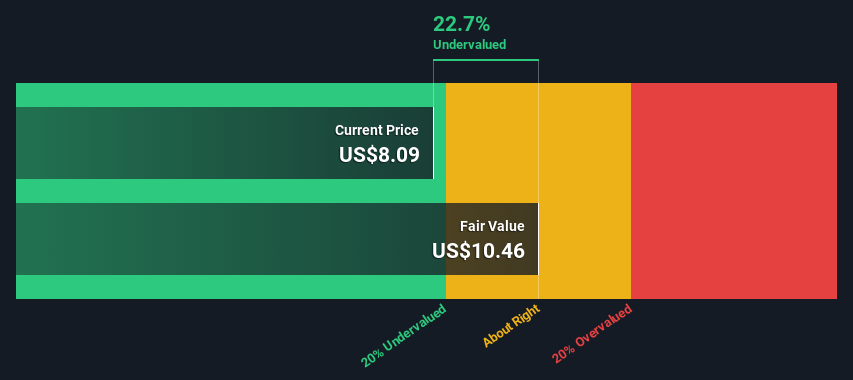
Are Investors Undervaluing ATI Physical Therapy, Inc. (NYSE:ATIP) By 23%?


Key Insights
- Using the 2 Stage Free Cash Flow to Equity, ATI Physical Therapy fair value estimate is US$10.46
- ATI Physical Therapy's US$8.09 share price signals that it might be 23% undervalued
- ATI Physical Therapy's peers seem to be trading at a higher discount to fair value based onthe industry average of 39%
Today we'll do a simple run through of a valuation method used to estimate the attractiveness of ATI Physical Therapy, Inc. (NYSE:ATIP) as an investment opportunity by taking the forecast future cash flows of the company and discounting them back to today's value. We will take advantage of the Discounted Cash Flow (DCF) model for this purpose. Believe it or not, it's not too difficult to follow, as you'll see from our example!
Companies can be valued in a lot of ways, so we would point out that a DCF is not perfect for every situation. Anyone interested in learning a bit more about intrinsic value should have a read of the Simply Wall St analysis model.
See our latest analysis for ATI Physical Therapy
The Model
We are going to use a two-stage DCF model, which, as the name states, takes into account two stages of growth. The first stage is generally a higher growth period which levels off heading towards the terminal value, captured in the second 'steady growth' period. In the first stage we need to estimate the cash flows to the business over the next ten years. Where possible we use analyst estimates, but when these aren't available we extrapolate the previous free cash flow (FCF) from the last estimate or reported value. We assume companies with shrinking free cash flow will slow their rate of shrinkage, and that companies with growing free cash flow will see their growth rate slow, over this period. We do this to reflect that growth tends to slow more in the early years than it does in later years.
A DCF is all about the idea that a dollar in the future is less valuable than a dollar today, and so the sum of these future cash flows is then discounted to today's value:
10-year free cash flow (FCF) estimate
| 2024 | 2025 | 2026 | 2027 | 2028 | 2029 | 2030 | 2031 | 2032 | 2033 | |
| Levered FCF ($, Millions) | -US$18.1m | US$519.0k | US$1.19m | US$2.28m | US$3.75m | US$5.47m | US$7.27m | US$8.99m | US$10.5m | US$11.9m |
| Growth Rate Estimate Source | Analyst x1 | Analyst x1 | Est @ 129.54% | Est @ 91.35% | Est @ 64.61% | Est @ 45.89% | Est @ 32.79% | Est @ 23.62% | Est @ 17.20% | Est @ 12.71% |
| Present Value ($, Millions) Discounted @ 12% | -US$16.1 | US$0.4 | US$0.8 | US$1.4 | US$2.1 | US$2.7 | US$3.2 | US$3.6 | US$3.7 | US$3.7 |
("Est" = FCF growth rate estimated by Simply Wall St)
Present Value of 10-year Cash Flow (PVCF) = US$5.7m
We now need to calculate the Terminal Value, which accounts for all the future cash flows after this ten year period. For a number of reasons a very conservative growth rate is used that cannot exceed that of a country's GDP growth. In this case we have used the 5-year average of the 10-year government bond yield (2.2%) to estimate future growth. In the same way as with the 10-year 'growth' period, we discount future cash flows to today's value, using a cost of equity of 12%.
Terminal Value (TV)= FCF2033 × (1 + g) ÷ (r – g) = US$12m× (1 + 2.2%) ÷ (12%– 2.2%) = US$121m
Present Value of Terminal Value (PVTV)= TV / (1 + r)10= US$121m÷ ( 1 + 12%)10= US$38m
The total value is the sum of cash flows for the next ten years plus the discounted terminal value, which results in the Total Equity Value, which in this case is US$44m. The last step is to then divide the equity value by the number of shares outstanding. Compared to the current share price of US$8.1, the company appears a touch undervalued at a 23% discount to where the stock price trades currently. The assumptions in any calculation have a big impact on the valuation, so it is better to view this as a rough estimate, not precise down to the last cent.
The Assumptions
We would point out that the most important inputs to a discounted cash flow are the discount rate and of course the actual cash flows. Part of investing is coming up with your own evaluation of a company's future performance, so try the calculation yourself and check your own assumptions. The DCF also does not consider the possible cyclicality of an industry, or a company's future capital requirements, so it does not give a full picture of a company's potential performance. Given that we are looking at ATI Physical Therapy as potential shareholders, the cost of equity is used as the discount rate, rather than the cost of capital (or weighted average cost of capital, WACC) which accounts for debt. In this calculation we've used 12%, which is based on a levered beta of 2.000. Beta is a measure of a stock's volatility, compared to the market as a whole. We get our beta from the industry average beta of globally comparable companies, with an imposed limit between 0.8 and 2.0, which is a reasonable range for a stable business.
SWOT Analysis for ATI Physical Therapy
- Debt is well covered by earnings.
- Shareholders have been diluted in the past year.
- Good value based on P/S ratio and estimated fair value.
- Debt is not well covered by operating cash flow.
- Has less than 3 years of cash runway based on current free cash flow.
Next Steps:
Whilst important, the DCF calculation shouldn't be the only metric you look at when researching a company. DCF models are not the be-all and end-all of investment valuation. Preferably you'd apply different cases and assumptions and see how they would impact the company's valuation. For instance, if the terminal value growth rate is adjusted slightly, it can dramatically alter the overall result. Why is the intrinsic value higher than the current share price? For ATI Physical Therapy, we've compiled three further items you should consider:
- Risks: Every company has them, and we've spotted 5 warning signs for ATI Physical Therapy (of which 1 doesn't sit too well with us!) you should know about.
- Future Earnings: How does ATIP's growth rate compare to its peers and the wider market? Dig deeper into the analyst consensus number for the upcoming years by interacting with our free analyst growth expectation chart.
- Other High Quality Alternatives: Do you like a good all-rounder? Explore our interactive list of high quality stocks to get an idea of what else is out there you may be missing!
PS. Simply Wall St updates its DCF calculation for every American stock every day, so if you want to find the intrinsic value of any other stock just search here.
New: Manage All Your Stock Portfolios in One Place
We've created the ultimate portfolio companion for stock investors, and it's free.
• Connect an unlimited number of Portfolios and see your total in one currency
• Be alerted to new Warning Signs or Risks via email or mobile
• Track the Fair Value of your stocks
Have feedback on this article? Concerned about the content? Get in touch with us directly. Alternatively, email editorial-team (at) simplywallst.com.
This article by Simply Wall St is general in nature. We provide commentary based on historical data and analyst forecasts only using an unbiased methodology and our articles are not intended to be financial advice. It does not constitute a recommendation to buy or sell any stock, and does not take account of your objectives, or your financial situation. We aim to bring you long-term focused analysis driven by fundamental data. Note that our analysis may not factor in the latest price-sensitive company announcements or qualitative material. Simply Wall St has no position in any stocks mentioned.
About OTCPK:ATIP
ATI Physical Therapy
Operates as an outpatient physical therapy provider that specializes in outpatient rehabilitation and adjacent healthcare services in the United States.
Moderate and fair value.

