
Advertisement
- United States
- /
- Medical Equipment
- /
- NasdaqCM:ZJYL
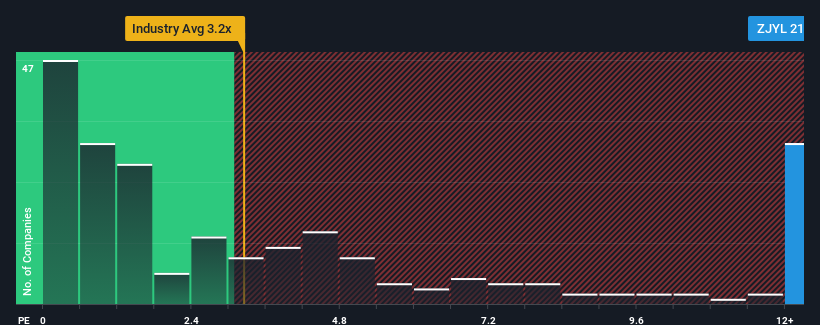
Some Confidence Is Lacking In Jin Medical International Ltd. (NASDAQ:ZJYL) As Shares Slide 31%
Jin Medical International Ltd. (NASDAQ:ZJYL) shares have retraced a considerable 31% in the last month, reversing a fair amount of their solid recent performance. Nonetheless, the last 30 days have barely left a scratch on the stock's annual performance, which is up a whopping 413%.
Although its price has dipped substantially, Jin Medical International may still be sending very bearish signals at the moment with a price-to-sales (or "P/S") ratio of 21x, since almost half of all companies in the Medical Equipment industry in the United States have P/S ratios under 3.2x and even P/S lower than 1.2x are not unusual. However, the P/S might be quite high for a reason and it requires further investigation to determine if it's justified.
View our latest analysis for Jin Medical International
How Jin Medical International Has Been Performing
For example, consider that Jin Medical International's financial performance has been pretty ordinary lately as revenue growth is non-existent. Perhaps the market believes that revenue growth will improve markedly over current levels, inflating the P/S ratio. If not, then existing shareholders may be a little nervous about the viability of the share price.
Although there are no analyst estimates available for Jin Medical International, take a look at this free data-rich visualisation to see how the company stacks up on earnings, revenue and cash flow.What Are Revenue Growth Metrics Telling Us About The High P/S?
In order to justify its P/S ratio, Jin Medical International would need to produce outstanding growth that's well in excess of the industry.
If we review the last year of revenue, the company posted a result that saw barely any deviation from a year ago. Fortunately, a few good years before that means that it was still able to grow revenue by 9.1% in total over the last three years. Accordingly, shareholders probably wouldn't have been overly satisfied with the unstable medium-term growth rates.
Comparing the recent medium-term revenue trends against the industry's one-year growth forecast of 9.0% shows it's noticeably less attractive.
In light of this, it's alarming that Jin Medical International's P/S sits above the majority of other companies. Apparently many investors in the company are way more bullish than recent times would indicate and aren't willing to let go of their stock at any price. There's a good chance existing shareholders are setting themselves up for future disappointment if the P/S falls to levels more in line with recent growth rates.
What We Can Learn From Jin Medical International's P/S?
A significant share price dive has done very little to deflate Jin Medical International's very lofty P/S. Generally, our preference is to limit the use of the price-to-sales ratio to establishing what the market thinks about the overall health of a company.
The fact that Jin Medical International currently trades on a higher P/S relative to the industry is an oddity, since its recent three-year growth is lower than the wider industry forecast. Right now we aren't comfortable with the high P/S as this revenue performance isn't likely to support such positive sentiment for long. If recent medium-term revenue trends continue, it will place shareholders' investments at significant risk and potential investors in danger of paying an excessive premium.
Don't forget that there may be other risks. For instance, we've identified 2 warning signs for Jin Medical International that you should be aware of.
If these risks are making you reconsider your opinion on Jin Medical International, explore our interactive list of high quality stocks to get an idea of what else is out there.
New: Manage All Your Stock Portfolios in One Place
We've created the ultimate portfolio companion for stock investors, and it's free.
• Connect an unlimited number of Portfolios and see your total in one currency
• Be alerted to new Warning Signs or Risks via email or mobile
• Track the Fair Value of your stocks
Have feedback on this article? Concerned about the content? Get in touch with us directly. Alternatively, email editorial-team (at) simplywallst.com.
This article by Simply Wall St is general in nature. We provide commentary based on historical data and analyst forecasts only using an unbiased methodology and our articles are not intended to be financial advice. It does not constitute a recommendation to buy or sell any stock, and does not take account of your objectives, or your financial situation. We aim to bring you long-term focused analysis driven by fundamental data. Note that our analysis may not factor in the latest price-sensitive company announcements or qualitative material. Simply Wall St has no position in any stocks mentioned.
About NasdaqCM:ZJYL
Jin Medical International
Engages in the design, development, manufacture, and sale of wheelchair and other living aids products for people with disabilities, the elderly, and people recovering from injury.
Adequate balance sheet with slight risk.
Similar Companies
Market Insights

Advertisement
Community Narratives
The Next Phase of Energy Storage: How NeoVolta Is Tackling America’s Power Crunch
Fair Value US$7.50|35.1% undervalued
MA
Community Contributor
Why EnSilica is Worth Possibly 13x its Current Price
Fair Value UK£5.00|89.8% undervalued
DO
Community Contributor
M&A Activity, Industry Diversification & A Defense Contract Monopoly Will Push BWXT For Healthy Long-Term Growth
Fair Value US$220.00|15.2% undervalued
CL
Community Contributor
A case for Cassiar Gold Corp (TSXV: GLDC) to reach CAD$8-10 before 2030 (X30-37)
Fair Value CA$10.00|96.0% undervalued
AG
Community Contributor