
Advertisement
- United States
- /
- Medical Equipment
- /
- NasdaqGM:STAA
A Look At The Fair Value Of STAAR Surgical Company (NASDAQ:STAA)

Key Insights
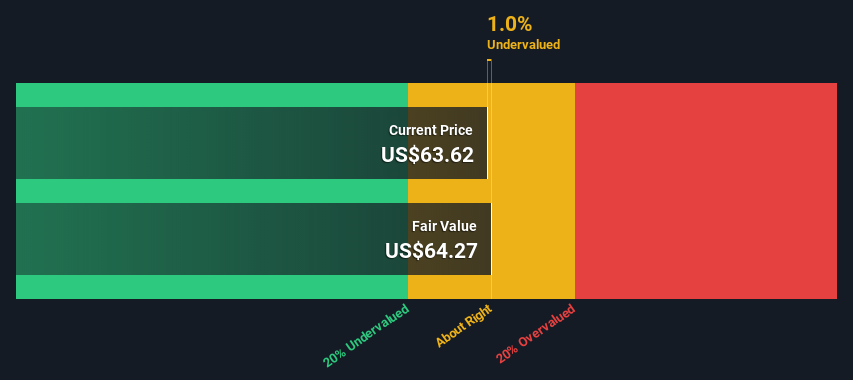
- STAAR Surgical's estimated fair value is US$64.27 based on 2 Stage Free Cash Flow to Equity
- STAAR Surgical's US$63.62 share price indicates it is trading at similar levels as its fair value estimate
- Analyst price target for STAA is US$79.50, which is 24% above our fair value estimate
Today we'll do a simple run through of a valuation method used to estimate the attractiveness of STAAR Surgical Company (NASDAQ:STAA) as an investment opportunity by estimating the company's future cash flows and discounting them to their present value. One way to achieve this is by employing the Discounted Cash Flow (DCF) model. It may sound complicated, but actually it is quite simple!
We would caution that there are many ways of valuing a company and, like the DCF, each technique has advantages and disadvantages in certain scenarios. For those who are keen learners of equity analysis, the Simply Wall St analysis model here may be something of interest to you.
View our latest analysis for STAAR Surgical
Step By Step Through The Calculation
We are going to use a two-stage DCF model, which, as the name states, takes into account two stages of growth. The first stage is generally a higher growth period which levels off heading towards the terminal value, captured in the second 'steady growth' period. To start off with, we need to estimate the next ten years of cash flows. Where possible we use analyst estimates, but when these aren't available we extrapolate the previous free cash flow (FCF) from the last estimate or reported value. We assume companies with shrinking free cash flow will slow their rate of shrinkage, and that companies with growing free cash flow will see their growth rate slow, over this period. We do this to reflect that growth tends to slow more in the early years than it does in later years.
A DCF is all about the idea that a dollar in the future is less valuable than a dollar today, and so the sum of these future cash flows is then discounted to today's value:
10-year free cash flow (FCF) estimate
| 2023 | 2024 | 2025 | 2026 | 2027 | 2028 | 2029 | 2030 | 2031 | 2032 | |
| Levered FCF ($, Millions) | US$14.2m | US$59.8m | US$91.5m | US$122.3m | US$150.6m | US$171.7m | US$189.5m | US$204.5m | US$217.1m | US$227.8m |
| Growth Rate Estimate Source | Analyst x1 | Analyst x2 | Analyst x1 | Analyst x1 | Analyst x1 | Est @ 13.99% | Est @ 10.41% | Est @ 7.91% | Est @ 6.16% | Est @ 4.93% |
| Present Value ($, Millions) Discounted @ 7.3% | US$13.2 | US$51.9 | US$74.0 | US$92.2 | US$106 | US$112 | US$116 | US$116 | US$115 | US$112 |
("Est" = FCF growth rate estimated by Simply Wall St)
Present Value of 10-year Cash Flow (PVCF) = US$909m
The second stage is also known as Terminal Value, this is the business's cash flow after the first stage. For a number of reasons a very conservative growth rate is used that cannot exceed that of a country's GDP growth. In this case we have used the 5-year average of the 10-year government bond yield (2.1%) to estimate future growth. In the same way as with the 10-year 'growth' period, we discount future cash flows to today's value, using a cost of equity of 7.3%.
Terminal Value (TV)= FCF2032 × (1 + g) ÷ (r – g) = US$228m× (1 + 2.1%) ÷ (7.3%– 2.1%) = US$4.4b
Present Value of Terminal Value (PVTV)= TV / (1 + r)10= US$4.4b÷ ( 1 + 7.3%)10= US$2.2b
The total value is the sum of cash flows for the next ten years plus the discounted terminal value, which results in the Total Equity Value, which in this case is US$3.1b. To get the intrinsic value per share, we divide this by the total number of shares outstanding. Relative to the current share price of US$63.6, the company appears about fair value at a 1.0% discount to where the stock price trades currently. Valuations are imprecise instruments though, rather like a telescope - move a few degrees and end up in a different galaxy. Do keep this in mind.
The Assumptions
The calculation above is very dependent on two assumptions. The first is the discount rate and the other is the cash flows. If you don't agree with these result, have a go at the calculation yourself and play with the assumptions. The DCF also does not consider the possible cyclicality of an industry, or a company's future capital requirements, so it does not give a full picture of a company's potential performance. Given that we are looking at STAAR Surgical as potential shareholders, the cost of equity is used as the discount rate, rather than the cost of capital (or weighted average cost of capital, WACC) which accounts for debt. In this calculation we've used 7.3%, which is based on a levered beta of 0.882. Beta is a measure of a stock's volatility, compared to the market as a whole. We get our beta from the industry average beta of globally comparable companies, with an imposed limit between 0.8 and 2.0, which is a reasonable range for a stable business.
Next Steps:
Although the valuation of a company is important, it is only one of many factors that you need to assess for a company. DCF models are not the be-all and end-all of investment valuation. Preferably you'd apply different cases and assumptions and see how they would impact the company's valuation. For instance, if the terminal value growth rate is adjusted slightly, it can dramatically alter the overall result. For STAAR Surgical, there are three pertinent items you should assess:
- Risks: For example, we've discovered 2 warning signs for STAAR Surgical (1 makes us a bit uncomfortable!) that you should be aware of before investing here.
- Management:Have insiders been ramping up their shares to take advantage of the market's sentiment for STAA's future outlook? Check out our management and board analysis with insights on CEO compensation and governance factors.
- Other High Quality Alternatives: Do you like a good all-rounder? Explore our interactive list of high quality stocks to get an idea of what else is out there you may be missing!
PS. The Simply Wall St app conducts a discounted cash flow valuation for every stock on the NASDAQGM every day. If you want to find the calculation for other stocks just search here.
New: Manage All Your Stock Portfolios in One Place
We've created the ultimate portfolio companion for stock investors, and it's free.
• Connect an unlimited number of Portfolios and see your total in one currency
• Be alerted to new Warning Signs or Risks via email or mobile
• Track the Fair Value of your stocks
Have feedback on this article? Concerned about the content? Get in touch with us directly. Alternatively, email editorial-team (at) simplywallst.com.
This article by Simply Wall St is general in nature. We provide commentary based on historical data and analyst forecasts only using an unbiased methodology and our articles are not intended to be financial advice. It does not constitute a recommendation to buy or sell any stock, and does not take account of your objectives, or your financial situation. We aim to bring you long-term focused analysis driven by fundamental data. Note that our analysis may not factor in the latest price-sensitive company announcements or qualitative material. Simply Wall St has no position in any stocks mentioned.
About NasdaqGM:STAA
STAAR Surgical
Designs, develops, manufactures, and sells implantable lenses for the eye and accessory delivery systems to deliver the lenses into the eye.
Flawless balance sheet and fair value.
Similar Companies
Market Insights

Advertisement
Community Narratives

BMW cruising ahead with new EVs and premium models to boost revenue 5%
Fair Value €135.07|44.6% undervalued
UN
Community Contributor
EU#2 - From Humble Beginnings to Global Powerhouse
Fair Value DKK 851.04|46.4% undervalued
TO
Community Contributor