
Advertisement
- United States
- /
- Medical Equipment
- /
- NasdaqCM:SSKN
Investors Don't See Light At End Of STRATA Skin Sciences, Inc.'s (NASDAQ:SSKN) Tunnel And Push Stock Down 30%

The STRATA Skin Sciences, Inc. (NASDAQ:SSKN) share price has fared very poorly over the last month, falling by a substantial 30%. For any long-term shareholders, the last month ends a year to forget by locking in a 60% share price decline.
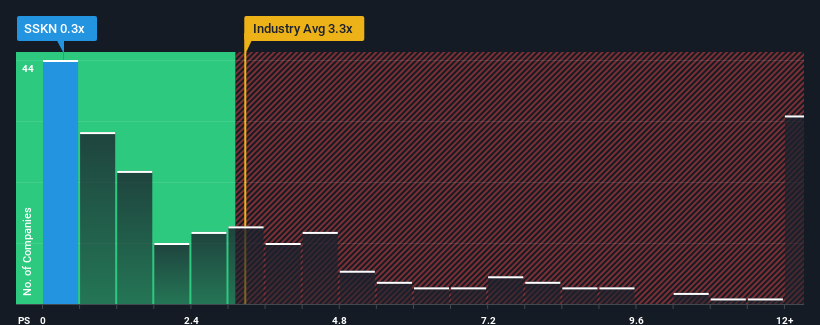
After such a large drop in price, STRATA Skin Sciences' price-to-sales (or "P/S") ratio of 0.3x might make it look like a strong buy right now compared to the wider Medical Equipment industry in the United States, where around half of the companies have P/S ratios above 3.3x and even P/S above 7x are quite common. Nonetheless, we'd need to dig a little deeper to determine if there is a rational basis for the highly reduced P/S.
Check out our latest analysis for STRATA Skin Sciences
What Does STRATA Skin Sciences' P/S Mean For Shareholders?
STRATA Skin Sciences hasn't been tracking well recently as its declining revenue compares poorly to other companies, which have seen some growth in their revenues on average. It seems that many are expecting the poor revenue performance to persist, which has repressed the P/S ratio. So while you could say the stock is cheap, investors will be looking for improvement before they see it as good value.
Want the full picture on analyst estimates for the company? Then our free report on STRATA Skin Sciences will help you uncover what's on the horizon.What Are Revenue Growth Metrics Telling Us About The Low P/S?
There's an inherent assumption that a company should far underperform the industry for P/S ratios like STRATA Skin Sciences' to be considered reasonable.
In reviewing the last year of financials, we were disheartened to see the company's revenues fell to the tune of 8.7%. That put a dampener on the good run it was having over the longer-term as its three-year revenue growth is still a noteworthy 28% in total. Accordingly, while they would have preferred to keep the run going, shareholders would be roughly satisfied with the medium-term rates of revenue growth.
Looking ahead now, revenue is anticipated to slump, contracting by 0.8% during the coming year according to the dual analysts following the company. Meanwhile, the broader industry is forecast to expand by 9.3%, which paints a poor picture.
In light of this, it's understandable that STRATA Skin Sciences' P/S would sit below the majority of other companies. Nonetheless, there's no guarantee the P/S has reached a floor yet with revenue going in reverse. There's potential for the P/S to fall to even lower levels if the company doesn't improve its top-line growth.
The Bottom Line On STRATA Skin Sciences' P/S
Having almost fallen off a cliff, STRATA Skin Sciences' share price has pulled its P/S way down as well. We'd say the price-to-sales ratio's power isn't primarily as a valuation instrument but rather to gauge current investor sentiment and future expectations.
As we suspected, our examination of STRATA Skin Sciences' analyst forecasts revealed that its outlook for shrinking revenue is contributing to its low P/S. As other companies in the industry are forecasting revenue growth, STRATA Skin Sciences' poor outlook justifies its low P/S ratio. Unless these conditions improve, they will continue to form a barrier for the share price around these levels.
Plus, you should also learn about these 4 warning signs we've spotted with STRATA Skin Sciences.
It's important to make sure you look for a great company, not just the first idea you come across. So if growing profitability aligns with your idea of a great company, take a peek at this free list of interesting companies with strong recent earnings growth (and a low P/E).
New: Manage All Your Stock Portfolios in One Place
We've created the ultimate portfolio companion for stock investors, and it's free.
• Connect an unlimited number of Portfolios and see your total in one currency
• Be alerted to new Warning Signs or Risks via email or mobile
• Track the Fair Value of your stocks
Have feedback on this article? Concerned about the content? Get in touch with us directly. Alternatively, email editorial-team (at) simplywallst.com.
This article by Simply Wall St is general in nature. We provide commentary based on historical data and analyst forecasts only using an unbiased methodology and our articles are not intended to be financial advice. It does not constitute a recommendation to buy or sell any stock, and does not take account of your objectives, or your financial situation. We aim to bring you long-term focused analysis driven by fundamental data. Note that our analysis may not factor in the latest price-sensitive company announcements or qualitative material. Simply Wall St has no position in any stocks mentioned.
About NasdaqCM:SSKN
STRATA Skin Sciences
A medical technology company, develops, commercializes, and markets products for the treatment of dermatologic conditions in the United States, China, Europe, the Middle East, Asia, Australia, South Africa, and Central and South America.
Fair value with mediocre balance sheet.
Similar Companies
Market Insights

Advertisement
Community Narratives
Pinterest will surge as advertising innovations ignite revenue growth
Fair Value US$42.63|27.0% undervalued
BR
Community Contributor
Brambles' Revenue Set to Climb 14% with Profit Margins Following
Fair Value AU$21.90|5.9% overvalued
RO
Community Contributor
Challenging Future for STG as Organic Sales Decline by 8.8%
Fair Value DKK 116.13|26.8% undervalued
KA
Community Contributor