
Advertisement
- United States
- /
- Healthcare Services
- /
- NasdaqGS:PDCO
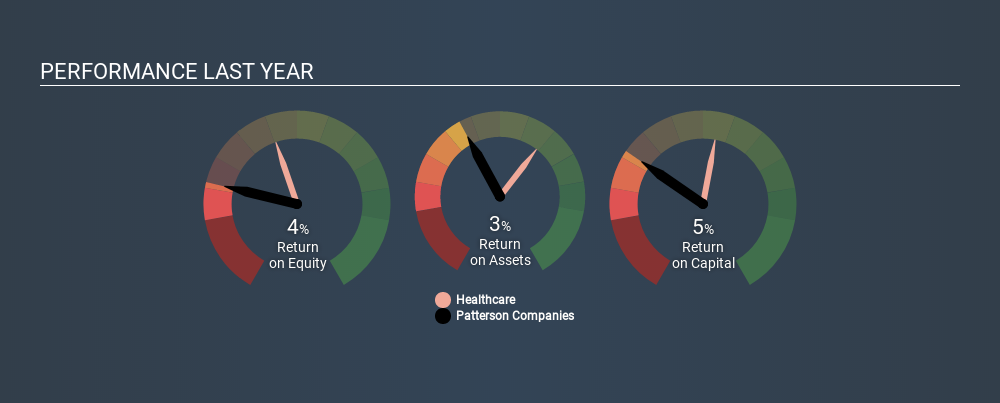
How Do Patterson Companies, Inc.’s (NASDAQ:PDCO) Returns Compare To Its Industry?

Today we'll evaluate Patterson Companies, Inc. (NASDAQ:PDCO) to determine whether it could have potential as an investment idea. Specifically, we're going to calculate its Return On Capital Employed (ROCE), in the hopes of getting some insight into the business.
First of all, we'll work out how to calculate ROCE. Next, we'll compare it to others in its industry. Then we'll determine how its current liabilities are affecting its ROCE.
What is Return On Capital Employed (ROCE)?
ROCE is a metric for evaluating how much pre-tax income (in percentage terms) a company earns on the capital invested in its business. All else being equal, a better business will have a higher ROCE. In brief, it is a useful tool, but it is not without drawbacks. Author Edwin Whiting says to be careful when comparing the ROCE of different businesses, since 'No two businesses are exactly alike.
So, How Do We Calculate ROCE?
The formula for calculating the return on capital employed is:
Return on Capital Employed = Earnings Before Interest and Tax (EBIT) ÷ (Total Assets - Current Liabilities)
Or for Patterson Companies:
0.054 = US$127m ÷ (US$3.4b - US$1.1b) (Based on the trailing twelve months to October 2019.)
Therefore, Patterson Companies has an ROCE of 5.4%.
View our latest analysis for Patterson Companies
Does Patterson Companies Have A Good ROCE?
ROCE is commonly used for comparing the performance of similar businesses. We can see Patterson Companies's ROCE is meaningfully below the Healthcare industry average of 11%. This could be seen as a negative, as it suggests some competitors may be employing their capital more efficiently. Separate from how Patterson Companies stacks up against its industry, its ROCE in absolute terms is mediocre; relative to the returns on government bonds. It is possible that there are more rewarding investments out there.
Patterson Companies's current ROCE of 5.4% is lower than 3 years ago, when the company reported a 13% ROCE. Therefore we wonder if the company is facing new headwinds. You can see in the image below how Patterson Companies's ROCE compares to its industry. Click to see more on past growth.
When considering this metric, keep in mind that it is backwards looking, and not necessarily predictive. ROCE can be misleading for companies in cyclical industries, with returns looking impressive during the boom times, but very weak during the busts. ROCE is only a point-in-time measure. Future performance is what matters, and you can see analyst predictions in our free report on analyst forecasts for the company.
Patterson Companies's Current Liabilities And Their Impact On Its ROCE
Current liabilities are short term bills and invoices that need to be paid in 12 months or less. Due to the way ROCE is calculated, a high level of current liabilities makes a company look as though it has less capital employed, and thus can (sometimes unfairly) boost the ROCE. To counteract this, we check if a company has high current liabilities, relative to its total assets.
Patterson Companies has total assets of US$3.4b and current liabilities of US$1.1b. Therefore its current liabilities are equivalent to approximately 31% of its total assets. Patterson Companies's middling level of current liabilities have the effect of boosting its ROCE a bit.
What We Can Learn From Patterson Companies's ROCE
With this level of liabilities and a mediocre ROCE, there are potentially better investments out there. But note: make sure you look for a great company, not just the first idea you come across. So take a peek at this free list of interesting companies with strong recent earnings growth (and a P/E ratio below 20).
For those who like to find winning investments this free list of growing companies with recent insider purchasing, could be just the ticket.
If you spot an error that warrants correction, please contact the editor at editorial-team@simplywallst.com. This article by Simply Wall St is general in nature. It does not constitute a recommendation to buy or sell any stock, and does not take account of your objectives, or your financial situation. Simply Wall St has no position in the stocks mentioned.
We aim to bring you long-term focused research analysis driven by fundamental data. Note that our analysis may not factor in the latest price-sensitive company announcements or qualitative material. Thank you for reading.
About NasdaqGS:PDCO
Patterson Companies
Engages in the distribution of dental and animal health products in the United States, the United Kingdom, and Canada.
Undervalued with mediocre balance sheet.
Similar Companies
Market Insights


Advertisement
Community Narratives
For the Emperor: Why Games Workshop Could Be a Star Investment
Fair Value UK£160.00|0.1% overvalued
RO
Community Contributor
Securitas will boost margins with AI and tech-driven services
Fair Value SEK 260.91|44.5% undervalued
UN
Community Contributor
A Leader in EV Charging with Growth Potential
Fair Value €27.00|20.9% undervalued
TI
Community Contributor