- United States
- /
- Healthtech
- /
- NasdaqGS:NXGN
Is There An Opportunity With NextGen Healthcare, Inc.'s (NASDAQ:NXGN) 49% Undervaluation?


Key Insights
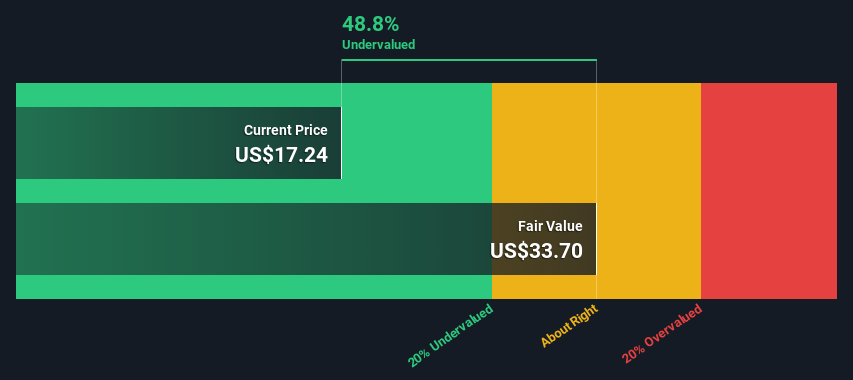
- The projected fair value for NextGen Healthcare is US$33.70 based on 2 Stage Free Cash Flow to Equity
- NextGen Healthcare is estimated to be 49% undervalued based on current share price of US$17.24
- Our fair value estimate is 69% higher than NextGen Healthcare's analyst price target of US$20.00
Today we will run through one way of estimating the intrinsic value of NextGen Healthcare, Inc. (NASDAQ:NXGN) by taking the expected future cash flows and discounting them to today's value. Our analysis will employ the Discounted Cash Flow (DCF) model. Models like these may appear beyond the comprehension of a lay person, but they're fairly easy to follow.
Companies can be valued in a lot of ways, so we would point out that a DCF is not perfect for every situation. If you want to learn more about discounted cash flow, the rationale behind this calculation can be read in detail in the Simply Wall St analysis model.
View our latest analysis for NextGen Healthcare
Step By Step Through The Calculation
We are going to use a two-stage DCF model, which, as the name states, takes into account two stages of growth. The first stage is generally a higher growth period which levels off heading towards the terminal value, captured in the second 'steady growth' period. In the first stage we need to estimate the cash flows to the business over the next ten years. Where possible we use analyst estimates, but when these aren't available we extrapolate the previous free cash flow (FCF) from the last estimate or reported value. We assume companies with shrinking free cash flow will slow their rate of shrinkage, and that companies with growing free cash flow will see their growth rate slow, over this period. We do this to reflect that growth tends to slow more in the early years than it does in later years.
A DCF is all about the idea that a dollar in the future is less valuable than a dollar today, so we need to discount the sum of these future cash flows to arrive at a present value estimate:
10-year free cash flow (FCF) estimate
| 2024 | 2025 | 2026 | 2027 | 2028 | 2029 | 2030 | 2031 | 2032 | 2033 | |
| Levered FCF ($, Millions) | US$21.7m | US$73.8m | US$92.7m | US$112.2m | US$126.2m | US$136.5m | US$145.2m | US$152.7m | US$159.1m | US$164.8m |
| Growth Rate Estimate Source | Analyst x2 | Analyst x3 | Analyst x2 | Analyst x1 | Analyst x1 | Est @ 8.19% | Est @ 6.38% | Est @ 5.11% | Est @ 4.22% | Est @ 3.60% |
| Present Value ($, Millions) Discounted @ 7.6% | US$20.1 | US$63.8 | US$74.5 | US$83.9 | US$87.7 | US$88.2 | US$87.3 | US$85.3 | US$82.6 | US$79.6 |
("Est" = FCF growth rate estimated by Simply Wall St)
Present Value of 10-year Cash Flow (PVCF) = US$753m
We now need to calculate the Terminal Value, which accounts for all the future cash flows after this ten year period. The Gordon Growth formula is used to calculate Terminal Value at a future annual growth rate equal to the 5-year average of the 10-year government bond yield of 2.2%. We discount the terminal cash flows to today's value at a cost of equity of 7.6%.
Terminal Value (TV)= FCF2033 × (1 + g) ÷ (r – g) = US$165m× (1 + 2.2%) ÷ (7.6%– 2.2%) = US$3.1b
Present Value of Terminal Value (PVTV)= TV / (1 + r)10= US$3.1b÷ ( 1 + 7.6%)10= US$1.5b
The total value is the sum of cash flows for the next ten years plus the discounted terminal value, which results in the Total Equity Value, which in this case is US$2.3b. The last step is to then divide the equity value by the number of shares outstanding. Compared to the current share price of US$17.2, the company appears quite good value at a 49% discount to where the stock price trades currently. Valuations are imprecise instruments though, rather like a telescope - move a few degrees and end up in a different galaxy. Do keep this in mind.
Important Assumptions
We would point out that the most important inputs to a discounted cash flow are the discount rate and of course the actual cash flows. You don't have to agree with these inputs, I recommend redoing the calculations yourself and playing with them. The DCF also does not consider the possible cyclicality of an industry, or a company's future capital requirements, so it does not give a full picture of a company's potential performance. Given that we are looking at NextGen Healthcare as potential shareholders, the cost of equity is used as the discount rate, rather than the cost of capital (or weighted average cost of capital, WACC) which accounts for debt. In this calculation we've used 7.6%, which is based on a levered beta of 1.080. Beta is a measure of a stock's volatility, compared to the market as a whole. We get our beta from the industry average beta of globally comparable companies, with an imposed limit between 0.8 and 2.0, which is a reasonable range for a stable business.
SWOT Analysis for NextGen Healthcare
- Debt is well covered by earnings.
- No major weaknesses identified for NXGN.
- Annual earnings are forecast to grow faster than the American market.
- Good value based on P/S ratio and estimated fair value.
- Debt is not well covered by operating cash flow.
- Annual revenue is forecast to grow slower than the American market.
Looking Ahead:
Although the valuation of a company is important, it is only one of many factors that you need to assess for a company. DCF models are not the be-all and end-all of investment valuation. Instead the best use for a DCF model is to test certain assumptions and theories to see if they would lead to the company being undervalued or overvalued. For instance, if the terminal value growth rate is adjusted slightly, it can dramatically alter the overall result. What is the reason for the share price sitting below the intrinsic value? For NextGen Healthcare, we've compiled three further items you should further examine:
- Risks: Every company has them, and we've spotted 1 warning sign for NextGen Healthcare you should know about.
- Future Earnings: How does NXGN's growth rate compare to its peers and the wider market? Dig deeper into the analyst consensus number for the upcoming years by interacting with our free analyst growth expectation chart.
- Other High Quality Alternatives: Do you like a good all-rounder? Explore our interactive list of high quality stocks to get an idea of what else is out there you may be missing!
PS. Simply Wall St updates its DCF calculation for every American stock every day, so if you want to find the intrinsic value of any other stock just search here.
If you're looking to trade NextGen Healthcare, open an account with the lowest-cost platform trusted by professionals, Interactive Brokers.
With clients in over 200 countries and territories, and access to 160 markets, IBKR lets you trade stocks, options, futures, forex, bonds and funds from a single integrated account.
Enjoy no hidden fees, no account minimums, and FX conversion rates as low as 0.03%, far better than what most brokers offer.
Sponsored ContentValuation is complex, but we're here to simplify it.
Discover if NextGen Healthcare might be undervalued or overvalued with our detailed analysis, featuring fair value estimates, potential risks, dividends, insider trades, and its financial condition.
Access Free AnalysisHave feedback on this article? Concerned about the content? Get in touch with us directly. Alternatively, email editorial-team (at) simplywallst.com.
This article by Simply Wall St is general in nature. We provide commentary based on historical data and analyst forecasts only using an unbiased methodology and our articles are not intended to be financial advice. It does not constitute a recommendation to buy or sell any stock, and does not take account of your objectives, or your financial situation. We aim to bring you long-term focused analysis driven by fundamental data. Note that our analysis may not factor in the latest price-sensitive company announcements or qualitative material. Simply Wall St has no position in any stocks mentioned.
About NasdaqGS:NXGN
NextGen Healthcare
NextGen Healthcare, Inc. provides healthcare technology solutions in the United States.
Adequate balance sheet with moderate growth potential.
Similar Companies
Market Insights

Community Narratives

