- United States
- /
- Medical Equipment
- /
- NasdaqGS:NEOG
Neogen (NASDAQ:NEOG) Will Want To Turn Around Its Return Trends


Finding a business that has the potential to grow substantially is not easy, but it is possible if we look at a few key financial metrics. In a perfect world, we'd like to see a company investing more capital into its business and ideally the returns earned from that capital are also increasing. If you see this, it typically means it's a company with a great business model and plenty of profitable reinvestment opportunities. Although, when we looked at Neogen (NASDAQ:NEOG), it didn't seem to tick all of these boxes.
What is Return On Capital Employed (ROCE)?
If you haven't worked with ROCE before, it measures the 'return' (pre-tax profit) a company generates from capital employed in its business. Analysts use this formula to calculate it for Neogen:
Return on Capital Employed = Earnings Before Interest and Tax (EBIT) ÷ (Total Assets - Current Liabilities)
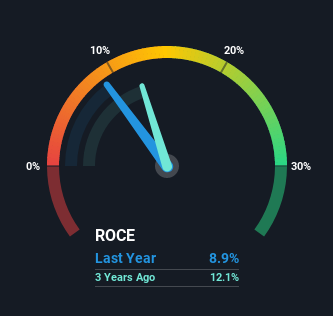
0.089 = US$77m ÷ (US$920m - US$54m) (Based on the trailing twelve months to May 2021).
Therefore, Neogen has an ROCE of 8.9%. Even though it's in line with the industry average of 8.9%, it's still a low return by itself.
View our latest analysis for Neogen
In the above chart we have measured Neogen's prior ROCE against its prior performance, but the future is arguably more important. If you'd like to see what analysts are forecasting going forward, you should check out our free report for Neogen.
The Trend Of ROCE
When we looked at the ROCE trend at Neogen, we didn't gain much confidence. Over the last five years, returns on capital have decreased to 8.9% from 13% five years ago. Although, given both revenue and the amount of assets employed in the business have increased, it could suggest the company is investing in growth, and the extra capital has led to a short-term reduction in ROCE. If these investments prove successful, this can bode very well for long term stock performance.
The Bottom Line
In summary, despite lower returns in the short term, we're encouraged to see that Neogen is reinvesting for growth and has higher sales as a result. And the stock has followed suit returning a meaningful 95% to shareholders over the last five years. So should these growth trends continue, we'd be optimistic on the stock going forward.
Neogen could be trading at an attractive price in other respects, so you might find our free intrinsic value estimation on our platform quite valuable.
For those who like to invest in solid companies, check out this free list of companies with solid balance sheets and high returns on equity.
If you decide to trade Neogen, use the lowest-cost* platform that is rated #1 Overall by Barron’s, Interactive Brokers. Trade stocks, options, futures, forex, bonds and funds on 135 markets, all from a single integrated account. Promoted
If you're looking to trade Neogen, open an account with the lowest-cost platform trusted by professionals, Interactive Brokers.
With clients in over 200 countries and territories, and access to 160 markets, IBKR lets you trade stocks, options, futures, forex, bonds and funds from a single integrated account.
Enjoy no hidden fees, no account minimums, and FX conversion rates as low as 0.03%, far better than what most brokers offer.
Sponsored ContentValuation is complex, but we're here to simplify it.
Discover if Neogen might be undervalued or overvalued with our detailed analysis, featuring fair value estimates, potential risks, dividends, insider trades, and its financial condition.
Access Free AnalysisThis article by Simply Wall St is general in nature. We provide commentary based on historical data and analyst forecasts only using an unbiased methodology and our articles are not intended to be financial advice. It does not constitute a recommendation to buy or sell any stock, and does not take account of your objectives, or your financial situation. We aim to bring you long-term focused analysis driven by fundamental data. Note that our analysis may not factor in the latest price-sensitive company announcements or qualitative material. Simply Wall St has no position in any stocks mentioned.
*Interactive Brokers Rated Lowest Cost Broker by StockBrokers.com Annual Online Review 2020
Have feedback on this article? Concerned about the content? Get in touch with us directly. Alternatively, email editorial-team (at) simplywallst.com.
About NasdaqGS:NEOG
Neogen
Engages in the development, manufacture, and marketing of various products and services dedicated to food and animal safety worldwide.
Slightly overvalued with imperfect balance sheet.
Similar Companies
Market Insights

Community Narratives

