- United States
- /
- Tobacco
- /
- NYSE:PM
Philip Morris International's (NYSE:PM) investors will be pleased with their respectable 76% return over the last five years


If you buy and hold a stock for many years, you'd hope to be making a profit. Better yet, you'd like to see the share price move up more than the market average. But Philip Morris International Inc. (NYSE:PM) has fallen short of that second goal, with a share price rise of 33% over five years, which is below the market return. Zooming in, the stock is up a respectable 12% in the last year.
With that in mind, it's worth seeing if the company's underlying fundamentals have been the driver of long term performance, or if there are some discrepancies.
Check out our latest analysis for Philip Morris International
To paraphrase Benjamin Graham: Over the short term the market is a voting machine, but over the long term it's a weighing machine. One way to examine how market sentiment has changed over time is to look at the interaction between a company's share price and its earnings per share (EPS).
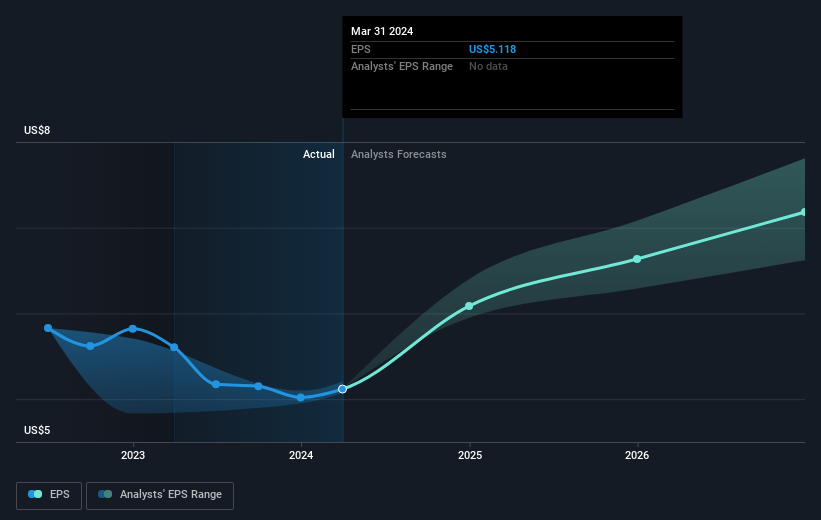
Over half a decade, Philip Morris International managed to grow its earnings per share at 0.7% a year. This EPS growth is lower than the 6% average annual increase in the share price. So it's fair to assume the market has a higher opinion of the business than it did five years ago. That's not necessarily surprising considering the five-year track record of earnings growth.
The image below shows how EPS has tracked over time (if you click on the image you can see greater detail).
Dive deeper into Philip Morris International's key metrics by checking this interactive graph of Philip Morris International's earnings, revenue and cash flow.
What About Dividends?
When looking at investment returns, it is important to consider the difference between total shareholder return (TSR) and share price return. Whereas the share price return only reflects the change in the share price, the TSR includes the value of dividends (assuming they were reinvested) and the benefit of any discounted capital raising or spin-off. So for companies that pay a generous dividend, the TSR is often a lot higher than the share price return. In the case of Philip Morris International, it has a TSR of 76% for the last 5 years. That exceeds its share price return that we previously mentioned. And there's no prize for guessing that the dividend payments largely explain the divergence!
A Different Perspective
Philip Morris International shareholders gained a total return of 18% during the year. But that return falls short of the market. On the bright side, that's still a gain, and it's actually better than the average return of 12% over half a decade This could indicate that the company is winning over new investors, as it pursues its strategy. While it is well worth considering the different impacts that market conditions can have on the share price, there are other factors that are even more important. Like risks, for instance. Every company has them, and we've spotted 3 warning signs for Philip Morris International (of which 1 can't be ignored!) you should know about.
But note: Philip Morris International may not be the best stock to buy. So take a peek at this free list of interesting companies with past earnings growth (and further growth forecast).
Please note, the market returns quoted in this article reflect the market weighted average returns of stocks that currently trade on American exchanges.
New: Manage All Your Stock Portfolios in One Place
We've created the ultimate portfolio companion for stock investors, and it's free.
• Connect an unlimited number of Portfolios and see your total in one currency
• Be alerted to new Warning Signs or Risks via email or mobile
• Track the Fair Value of your stocks
Have feedback on this article? Concerned about the content? Get in touch with us directly. Alternatively, email editorial-team (at) simplywallst.com.
This article by Simply Wall St is general in nature. We provide commentary based on historical data and analyst forecasts only using an unbiased methodology and our articles are not intended to be financial advice. It does not constitute a recommendation to buy or sell any stock, and does not take account of your objectives, or your financial situation. We aim to bring you long-term focused analysis driven by fundamental data. Note that our analysis may not factor in the latest price-sensitive company announcements or qualitative material. Simply Wall St has no position in any stocks mentioned.
About NYSE:PM
Philip Morris International
Operates as a tobacco company working to delivers a smoke-free future and evolving portfolio for the long-term to include products outside of the tobacco and nicotine sector.
Solid track record established dividend payer.

