
Advertisement
- United States
- /
- Food
- /
- NasdaqGS:JBSS
John B. Sanfilippo & Son (NASDAQ:JBSS) Has A Pretty Healthy Balance Sheet
Some say volatility, rather than debt, is the best way to think about risk as an investor, but Warren Buffett famously said that 'Volatility is far from synonymous with risk.' When we think about how risky a company is, we always like to look at its use of debt, since debt overload can lead to ruin. As with many other companies John B. Sanfilippo & Son, Inc. (NASDAQ:JBSS) makes use of debt. But should shareholders be worried about its use of debt?
Why Does Debt Bring Risk?
Generally speaking, debt only becomes a real problem when a company can't easily pay it off, either by raising capital or with its own cash flow. Part and parcel of capitalism is the process of 'creative destruction' where failed businesses are mercilessly liquidated by their bankers. While that is not too common, we often do see indebted companies permanently diluting shareholders because lenders force them to raise capital at a distressed price. Of course, the upside of debt is that it often represents cheap capital, especially when it replaces dilution in a company with the ability to reinvest at high rates of return. The first thing to do when considering how much debt a business uses is to look at its cash and debt together.
See our latest analysis for John B. Sanfilippo & Son
What Is John B. Sanfilippo & Son's Net Debt?
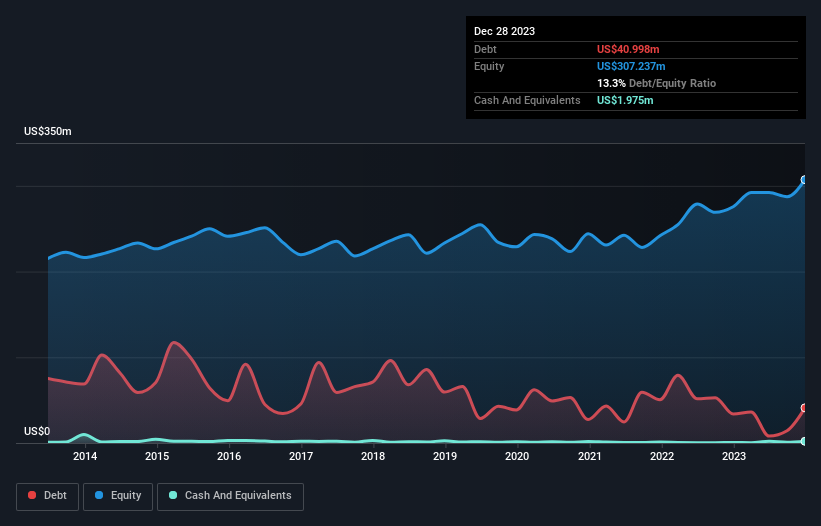
The image below, which you can click on for greater detail, shows that at December 2023 John B. Sanfilippo & Son had debt of US$41.0m, up from US$33.7m in one year. However, because it has a cash reserve of US$1.98m, its net debt is less, at about US$39.0m.
How Strong Is John B. Sanfilippo & Son's Balance Sheet?
The latest balance sheet data shows that John B. Sanfilippo & Son had liabilities of US$128.3m due within a year, and liabilities of US$48.9m falling due after that. Offsetting this, it had US$1.98m in cash and US$77.4m in receivables that were due within 12 months. So its liabilities total US$97.8m more than the combination of its cash and short-term receivables.
Given John B. Sanfilippo & Son has a market capitalization of US$1.15b, it's hard to believe these liabilities pose much threat. Having said that, it's clear that we should continue to monitor its balance sheet, lest it change for the worse.
We use two main ratios to inform us about debt levels relative to earnings. The first is net debt divided by earnings before interest, tax, depreciation, and amortization (EBITDA), while the second is how many times its earnings before interest and tax (EBIT) covers its interest expense (or its interest cover, for short). This way, we consider both the absolute quantum of the debt, as well as the interest rates paid on it.
John B. Sanfilippo & Son's net debt is only 0.35 times its EBITDA. And its EBIT easily covers its interest expense, being 41.9 times the size. So we're pretty relaxed about its super-conservative use of debt. The good news is that John B. Sanfilippo & Son has increased its EBIT by 6.3% over twelve months, which should ease any concerns about debt repayment. The balance sheet is clearly the area to focus on when you are analysing debt. But you can't view debt in total isolation; since John B. Sanfilippo & Son will need earnings to service that debt. So if you're keen to discover more about its earnings, it might be worth checking out this graph of its long term earnings trend.
Finally, a company can only pay off debt with cold hard cash, not accounting profits. So the logical step is to look at the proportion of that EBIT that is matched by actual free cash flow. During the last three years, John B. Sanfilippo & Son produced sturdy free cash flow equating to 71% of its EBIT, about what we'd expect. This free cash flow puts the company in a good position to pay down debt, when appropriate.
Our View
Happily, John B. Sanfilippo & Son's impressive interest cover implies it has the upper hand on its debt. And the good news does not stop there, as its net debt to EBITDA also supports that impression! Looking at the bigger picture, we think John B. Sanfilippo & Son's use of debt seems quite reasonable and we're not concerned about it. While debt does bring risk, when used wisely it can also bring a higher return on equity. The balance sheet is clearly the area to focus on when you are analysing debt. But ultimately, every company can contain risks that exist outside of the balance sheet. For example, we've discovered 1 warning sign for John B. Sanfilippo & Son that you should be aware of before investing here.
If, after all that, you're more interested in a fast growing company with a rock-solid balance sheet, then check out our list of net cash growth stocks without delay.
New: Manage All Your Stock Portfolios in One Place
We've created the ultimate portfolio companion for stock investors, and it's free.
• Connect an unlimited number of Portfolios and see your total in one currency
• Be alerted to new Warning Signs or Risks via email or mobile
• Track the Fair Value of your stocks
Have feedback on this article? Concerned about the content? Get in touch with us directly. Alternatively, email editorial-team (at) simplywallst.com.
This article by Simply Wall St is general in nature. We provide commentary based on historical data and analyst forecasts only using an unbiased methodology and our articles are not intended to be financial advice. It does not constitute a recommendation to buy or sell any stock, and does not take account of your objectives, or your financial situation. We aim to bring you long-term focused analysis driven by fundamental data. Note that our analysis may not factor in the latest price-sensitive company announcements or qualitative material. Simply Wall St has no position in any stocks mentioned.
About NasdaqGS:JBSS
John B. Sanfilippo & Son
Through its subsidiary, JBSS Ventures, LLC, processes and distributes tree nuts and peanuts in the United States.
Flawless balance sheet and slightly overvalued.
Similar Companies
Market Insights

Advertisement
Community Narratives
Quality at a Premium. A time to watch, not to buy?
Fair Value US$154.56|29.0% undervalued
DA
Community Contributor
GRAB: The Super-App at the Heart of Southeast Asia’s Digital Boom
Fair Value US$8.20|22.6% undervalued
BL
Community Contributor
Verve Group to Surge with 51.61% Revenue Growth
Fair Value €6.00|60.1% undervalued
ME
Community Contributor