- United States
- /
- Beverage
- /
- NasdaqCM:CELH
Estimating The Fair Value Of Celsius Holdings, Inc. (NASDAQ:CELH)


Key Insights
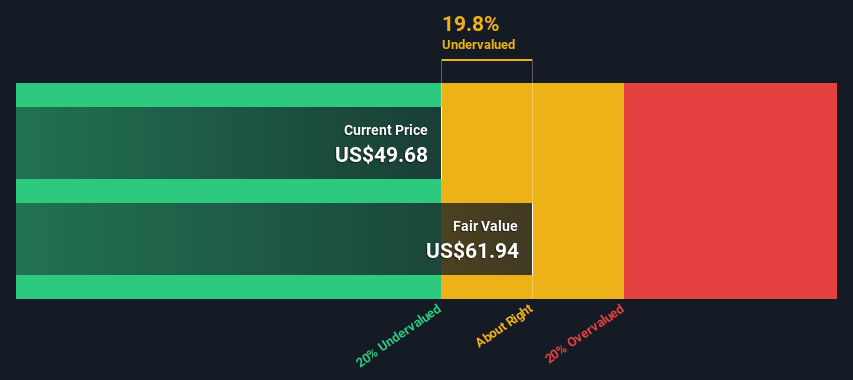
- The projected fair value for Celsius Holdings is US$61.94 based on 2 Stage Free Cash Flow to Equity
- Current share price of US$49.68 suggests Celsius Holdings is potentially trading close to its fair value
- Analyst price target for CELH is US$68.64, which is 11% above our fair value estimate
Does the December share price for Celsius Holdings, Inc. (NASDAQ:CELH) reflect what it's really worth? Today, we will estimate the stock's intrinsic value by taking the expected future cash flows and discounting them to their present value. This will be done using the Discounted Cash Flow (DCF) model. Believe it or not, it's not too difficult to follow, as you'll see from our example!
Companies can be valued in a lot of ways, so we would point out that a DCF is not perfect for every situation. Anyone interested in learning a bit more about intrinsic value should have a read of the Simply Wall St analysis model.
See our latest analysis for Celsius Holdings
The Model
We're using the 2-stage growth model, which simply means we take in account two stages of company's growth. In the initial period the company may have a higher growth rate and the second stage is usually assumed to have a stable growth rate. To start off with, we need to estimate the next ten years of cash flows. Where possible we use analyst estimates, but when these aren't available we extrapolate the previous free cash flow (FCF) from the last estimate or reported value. We assume companies with shrinking free cash flow will slow their rate of shrinkage, and that companies with growing free cash flow will see their growth rate slow, over this period. We do this to reflect that growth tends to slow more in the early years than it does in later years.
A DCF is all about the idea that a dollar in the future is less valuable than a dollar today, and so the sum of these future cash flows is then discounted to today's value:
10-year free cash flow (FCF) forecast
| 2024 | 2025 | 2026 | 2027 | 2028 | 2029 | 2030 | 2031 | 2032 | 2033 | |
| Levered FCF ($, Millions) | US$176.3m | US$280.6m | US$337.0m | US$441.0m | US$519.9m | US$588.5m | US$646.8m | US$695.9m | US$737.5m | US$773.3m |
| Growth Rate Estimate Source | Analyst x4 | Analyst x2 | Analyst x1 | Analyst x1 | Est @ 17.89% | Est @ 13.19% | Est @ 9.90% | Est @ 7.60% | Est @ 5.98% | Est @ 4.85% |
| Present Value ($, Millions) Discounted @ 6.2% | US$166 | US$249 | US$281 | US$346 | US$385 | US$410 | US$424 | US$429 | US$428 | US$423 |
("Est" = FCF growth rate estimated by Simply Wall St)
Present Value of 10-year Cash Flow (PVCF) = US$3.5b
After calculating the present value of future cash flows in the initial 10-year period, we need to calculate the Terminal Value, which accounts for all future cash flows beyond the first stage. For a number of reasons a very conservative growth rate is used that cannot exceed that of a country's GDP growth. In this case we have used the 5-year average of the 10-year government bond yield (2.2%) to estimate future growth. In the same way as with the 10-year 'growth' period, we discount future cash flows to today's value, using a cost of equity of 6.2%.
Terminal Value (TV)= FCF2033 × (1 + g) ÷ (r – g) = US$773m× (1 + 2.2%) ÷ (6.2%– 2.2%) = US$20b
Present Value of Terminal Value (PVTV)= TV / (1 + r)10= US$20b÷ ( 1 + 6.2%)10= US$11b
The total value, or equity value, is then the sum of the present value of the future cash flows, which in this case is US$14b. The last step is to then divide the equity value by the number of shares outstanding. Compared to the current share price of US$49.7, the company appears about fair value at a 20% discount to where the stock price trades currently. Valuations are imprecise instruments though, rather like a telescope - move a few degrees and end up in a different galaxy. Do keep this in mind.
The Assumptions
The calculation above is very dependent on two assumptions. The first is the discount rate and the other is the cash flows. You don't have to agree with these inputs, I recommend redoing the calculations yourself and playing with them. The DCF also does not consider the possible cyclicality of an industry, or a company's future capital requirements, so it does not give a full picture of a company's potential performance. Given that we are looking at Celsius Holdings as potential shareholders, the cost of equity is used as the discount rate, rather than the cost of capital (or weighted average cost of capital, WACC) which accounts for debt. In this calculation we've used 6.2%, which is based on a levered beta of 0.800. Beta is a measure of a stock's volatility, compared to the market as a whole. We get our beta from the industry average beta of globally comparable companies, with an imposed limit between 0.8 and 2.0, which is a reasonable range for a stable business.
Looking Ahead:
Valuation is only one side of the coin in terms of building your investment thesis, and it is only one of many factors that you need to assess for a company. It's not possible to obtain a foolproof valuation with a DCF model. Rather it should be seen as a guide to "what assumptions need to be true for this stock to be under/overvalued?" If a company grows at a different rate, or if its cost of equity or risk free rate changes sharply, the output can look very different. For Celsius Holdings, there are three pertinent elements you should explore:
- Risks: For example, we've discovered 2 warning signs for Celsius Holdings (1 is significant!) that you should be aware of before investing here.
- Management:Have insiders been ramping up their shares to take advantage of the market's sentiment for CELH's future outlook? Check out our management and board analysis with insights on CEO compensation and governance factors.
- Other High Quality Alternatives: Do you like a good all-rounder? Explore our interactive list of high quality stocks to get an idea of what else is out there you may be missing!
PS. Simply Wall St updates its DCF calculation for every American stock every day, so if you want to find the intrinsic value of any other stock just search here.
New: AI Stock Screener & Alerts
Our new AI Stock Screener scans the market every day to uncover opportunities.
• Dividend Powerhouses (3%+ Yield)
• Undervalued Small Caps with Insider Buying
• High growth Tech and AI Companies
Or build your own from over 50 metrics.
Have feedback on this article? Concerned about the content? Get in touch with us directly. Alternatively, email editorial-team (at) simplywallst.com.
This article by Simply Wall St is general in nature. We provide commentary based on historical data and analyst forecasts only using an unbiased methodology and our articles are not intended to be financial advice. It does not constitute a recommendation to buy or sell any stock, and does not take account of your objectives, or your financial situation. We aim to bring you long-term focused analysis driven by fundamental data. Note that our analysis may not factor in the latest price-sensitive company announcements or qualitative material. Simply Wall St has no position in any stocks mentioned.
About NasdaqCM:CELH
Celsius Holdings
Develops, processes, markets, distributes, and sells functional energy drinks and liquid supplements in the United States, Australia, New Zealand, Canadian, European, Middle Eastern, Asia-Pacific, and internationally.
Flawless balance sheet with high growth potential.

