Advertisement
- United States
- /
- Oil and Gas
- /
- NYSE:TRGP
Are Targa Shares Attractive After 18.8% Drop and New Permian Expansion Plans?

Simply Wall St
Reviewed by Bailey Pemberton
If you are eyeing Targa Resources and wondering what the recent price swings mean for your investment strategy, you are definitely not alone. The stock has traveled quite a journey over the past few months, with some short-term bumps but an undeniably impressive long-term trajectory. In the last week, shares declined by 2.5%. Zooming out, they are down 10.7% over the past month and have slipped 18.8% so far this year. However, putting these dips in context, the stock is actually up 134.4% over the past three years, and a remarkable 859.7% over five years. That kind of growth does not just happen by accident, and it has certainly caught the attention of both seasoned investors and newcomers alike.
Of course, market mood shifts and sector developments are part of the story, with energy infrastructure and midstream companies like Targa Resources experiencing a mix of changing risk perceptions and shifting investor appetites lately. These mood swings might look like headwinds, but they can also serve up opportunity for those willing to dig into the numbers.
If valuation is on your mind, here is a good starting point: Targa Resources clocks a valuation score of 3 out of 6 using classic undervaluation checks. So, it passes on half but not all of the most common screens analysts like to use. In the next section, let’s take a closer look at those individual checks and what they may mean for figuring out if this stock is actually a bargain right now. But stay tuned, because there is a smarter and more insightful way to put all of this in context. More on that before we wrap up.
Why Targa Resources is lagging behind its peers
Approach 1: Targa Resources Discounted Cash Flow (DCF) Analysis
The Discounted Cash Flow (DCF) model calculates a company’s value by estimating its expected future cash flows and then discounting them back to today's dollar value. This approach is widely used because it focuses on the underlying cash-generating power of the business, rather than just comparing it to peers or following market trends.
For Targa Resources, the most recent Free Cash Flow comes in at $1.02 Billion. Analyst estimates suggest this will grow steadily, reaching about $2.50 Billion by 2029. While analyst projections extend just five years out, additional estimates are extrapolated beyond that, with total projected Free Cash Flows in ten years climbing even higher toward $3.43 Billion.
Using these cash flow forecasts and bringing them back to present value, the DCF model assigns an intrinsic value of $264.24 per share. That is roughly 43.7% above the current trading price and indicates the stock may be significantly undervalued according to this method.
This sizable disconnect suggests the market may not be fully appreciating the long-term cash-generating potential of Targa Resources. For investors comfortable with a valuation based on future cash flow expectations, this stock might deserve a closer look.
Result: UNDERVALUED
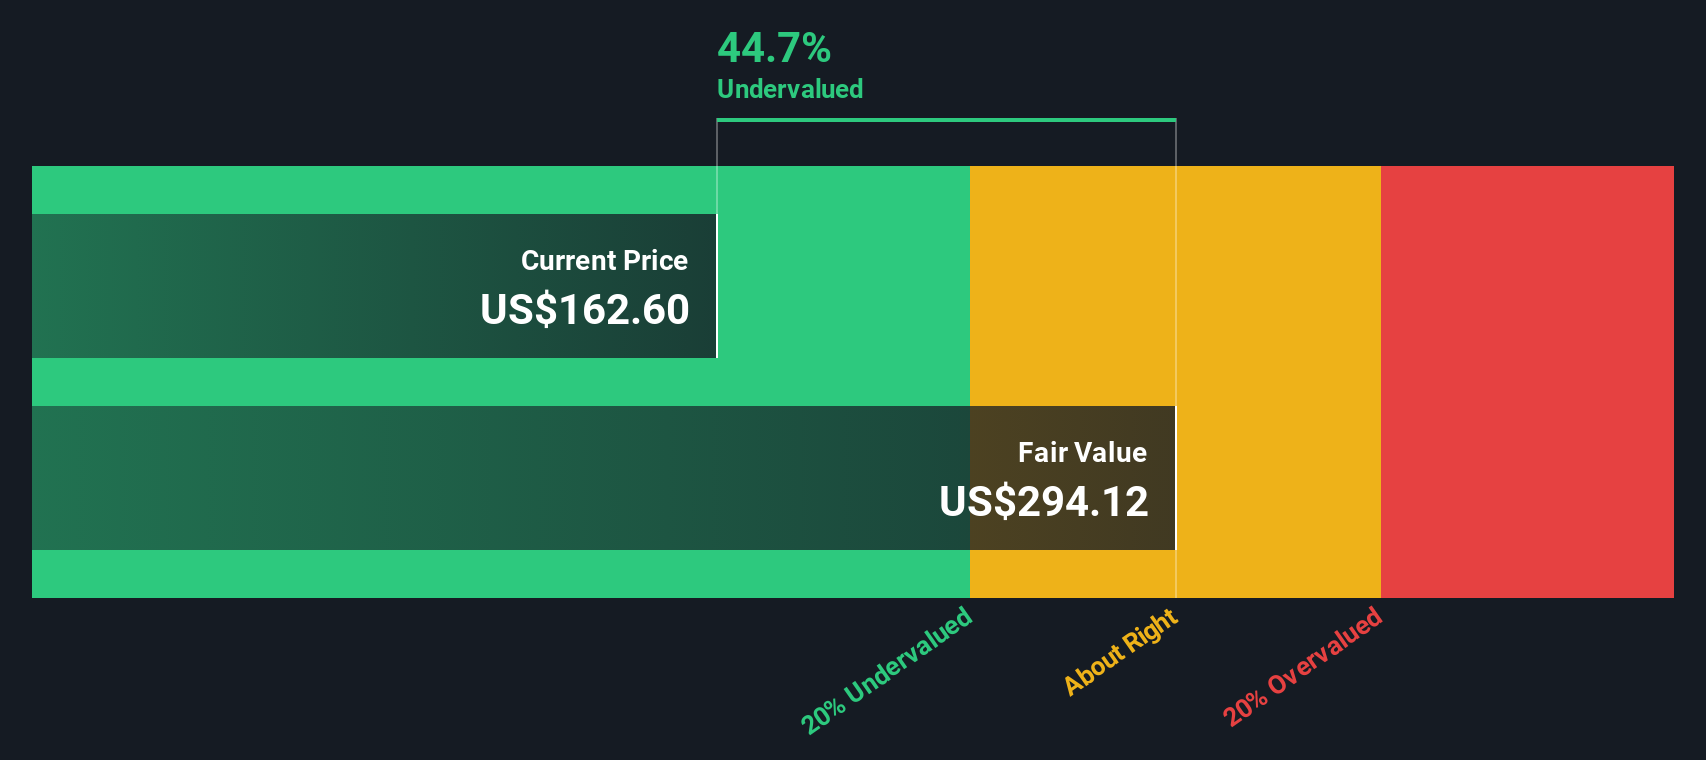
Our Discounted Cash Flow (DCF) analysis suggests Targa Resources is undervalued by 43.7%. Track this in your watchlist or portfolio, or discover more undervalued stocks.
Approach 2: Targa Resources Price vs Earnings
The Price-to-Earnings (PE) ratio is a time-tested way to value companies that are generating steady profits, such as Targa Resources. For businesses with consistent earnings, the PE ratio helps investors gauge how much they are paying for each dollar of profit. It is especially useful for companies like Targa, where growth is on the horizon, but profits are already rolling in.
Importantly, what counts as a “normal” or “fair” PE ratio can shift depending on a company’s expected earnings growth and its risk profile. Higher growth prospects or lower business risks generally justify a higher PE, while slower growth or added uncertainties typically warrant a lower ratio. Therefore, context is key when comparing PE ratios across companies or industries.
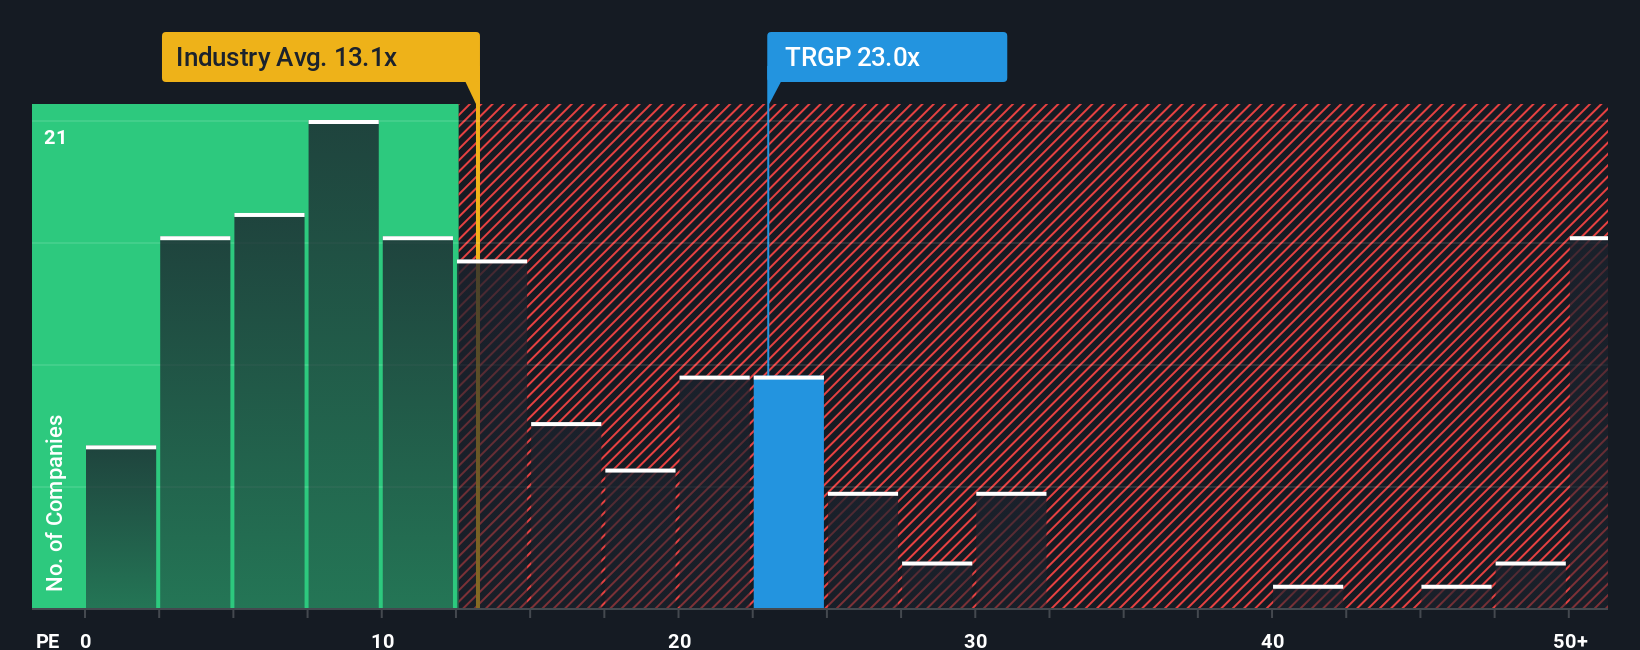
Targa Resources currently trades at a PE ratio of 21x. That is noticeably higher than both the oil and gas industry average of about 13x and the average of its closest peers at 15x. However, looking beyond simple averages, Simply Wall St’s proprietary “Fair Ratio” model paints a more nuanced picture. The Fair Ratio for Targa comes in at about 19x, reflecting the company’s specific growth outlook, margins, size, and sector risks better than a plain industry comparison ever could. Because this Fair Ratio incorporates these unique factors, it provides a more balanced view of value.
With Targa’s current 21x PE sitting just slightly above its Fair Ratio of 19x, the stock appears to be trading a little on the expensive side based on earnings, but not alarmingly so.
Result: OVERVALUED
PE ratios tell one story, but what if the real opportunity lies elsewhere? Discover companies where insiders are betting big on explosive growth.
Upgrade Your Decision Making: Choose your Targa Resources Narrative
Earlier we mentioned that there is an even better way to understand valuation, so let’s introduce you to Narratives. A Narrative is simply your story: the big-picture insight or thesis you have about Targa Resources, combined with your own expectations for its future revenue, earnings, and margins. Narratives bring together the company’s unique growth drivers, risks, and future outlook into a single financial forecast, which then leads directly to your own version of “fair value.”
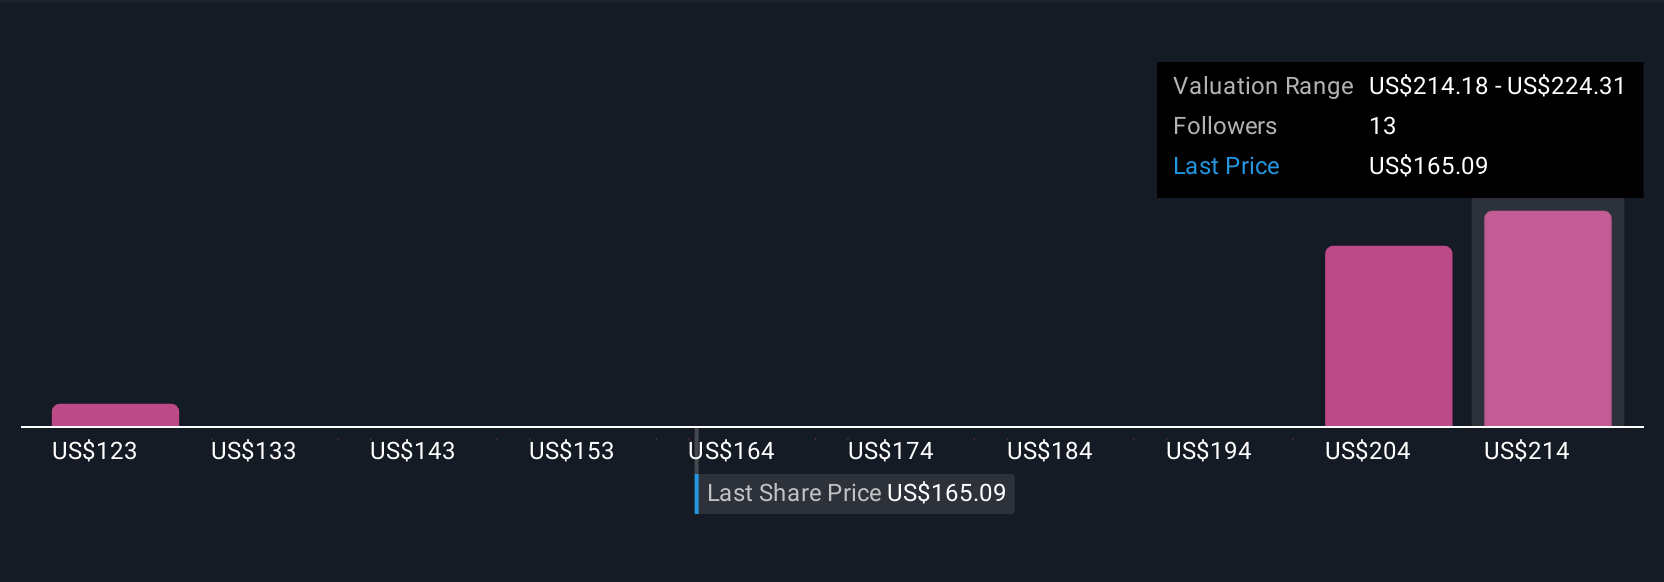
On Simply Wall St's Community page, millions of investors use Narratives to clearly express their perspective, compare fair value to the current price, and easily decide if they want to buy or sell. The power of Narratives is that they are updated automatically whenever fresh news or earnings become available, letting investors stay nimble as the market changes. For example, one Targa Resources Narrative sees the company’s new Permian and export developments justifying a bullish price target of $240.00; meanwhile, a more cautious view, concerned about rising costs and competition, values the stock at just $186.00. Narratives make it easy to see both sides, ground your decision in your own research, and adapt as new information comes to light.
Do you think there's more to the story for Targa Resources? Create your own Narrative to let the Community know!
This article by Simply Wall St is general in nature. We provide commentary based on historical data and analyst forecasts only using an unbiased methodology and our articles are not intended to be financial advice. It does not constitute a recommendation to buy or sell any stock, and does not take account of your objectives, or your financial situation. We aim to bring you long-term focused analysis driven by fundamental data. Note that our analysis may not factor in the latest price-sensitive company announcements or qualitative material. Simply Wall St has no position in any stocks mentioned.
Valuation is complex, but we're here to simplify it.
Discover if Targa Resources might be undervalued or overvalued with our detailed analysis, featuring fair value estimates, potential risks, dividends, insider trades, and its financial condition.
Access Free AnalysisHave feedback on this article? Concerned about the content? Get in touch with us directly. Alternatively, email editorial-team@simplywallst.com
About NYSE:TRGP
Targa Resources
Together with its subsidiary, Targa Resources Partners LP, owns, operates, acquires, and develops a portfolio of complementary domestic infrastructure assets in North America.
Proven track record and fair value.
Similar Companies
Market Insights

Advertisement
Community Narratives
Kodiak AI - a potential 100 bagger opportunity?
Fair Value US$14.00|44.7% undervalued
DA
Community Contributor
A Fair Price for a Great Business Facing Real Threats
Fair Value US$383.06|13.0% undervalued
IM
Community Contributor
AXON And Shopify Integration Will Unlock Global Mobile Advertising
Fair Value US$646.30|0% overvalued
AN
Based on Analyst Price Targets