
Advertisement
- United States
- /
- Energy Services
- /
- NYSE:SEI
After Leaping 35% Solaris Energy Infrastructure, Inc. (NYSE:SEI) Shares Are Not Flying Under The Radar
The Solaris Energy Infrastructure, Inc. (NYSE:SEI) share price has done very well over the last month, posting an excellent gain of 35%. This latest share price bounce rounds out a remarkable 302% gain over the last twelve months.
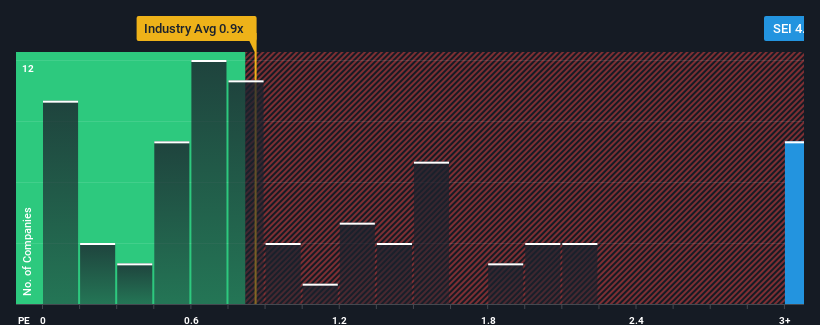
Since its price has surged higher, you could be forgiven for thinking Solaris Energy Infrastructure is a stock to steer clear of with a price-to-sales ratios (or "P/S") of 4x, considering almost half the companies in the United States' Energy Services industry have P/S ratios below 0.8x. However, the P/S might be quite high for a reason and it requires further investigation to determine if it's justified.
See our latest analysis for Solaris Energy Infrastructure
What Does Solaris Energy Infrastructure's P/S Mean For Shareholders?
Solaris Energy Infrastructure could be doing better as it's been growing revenue less than most other companies lately. One possibility is that the P/S ratio is high because investors think this lacklustre revenue performance will improve markedly. You'd really hope so, otherwise you're paying a pretty hefty price for no particular reason.
Keen to find out how analysts think Solaris Energy Infrastructure's future stacks up against the industry? In that case, our free report is a great place to start.What Are Revenue Growth Metrics Telling Us About The High P/S?
In order to justify its P/S ratio, Solaris Energy Infrastructure would need to produce outstanding growth that's well in excess of the industry.
If we review the last year of revenue growth, the company posted a worthy increase of 6.9%. This was backed up an excellent period prior to see revenue up by 97% in total over the last three years. So we can start by confirming that the company has done a great job of growing revenues over that time.
Shifting to the future, estimates from the dual analysts covering the company suggest revenue should grow by 39% each year over the next three years. With the industry only predicted to deliver 4.9% each year, the company is positioned for a stronger revenue result.
With this in mind, it's not hard to understand why Solaris Energy Infrastructure's P/S is high relative to its industry peers. Apparently shareholders aren't keen to offload something that is potentially eyeing a more prosperous future.
What Does Solaris Energy Infrastructure's P/S Mean For Investors?
The strong share price surge has lead to Solaris Energy Infrastructure's P/S soaring as well. Generally, our preference is to limit the use of the price-to-sales ratio to establishing what the market thinks about the overall health of a company.
As we suspected, our examination of Solaris Energy Infrastructure's analyst forecasts revealed that its superior revenue outlook is contributing to its high P/S. At this stage investors feel the potential for a deterioration in revenues is quite remote, justifying the elevated P/S ratio. Unless these conditions change, they will continue to provide strong support to the share price.
Don't forget that there may be other risks. For instance, we've identified 4 warning signs for Solaris Energy Infrastructure (2 are a bit unpleasant) you should be aware of.
If companies with solid past earnings growth is up your alley, you may wish to see this free collection of other companies with strong earnings growth and low P/E ratios.
New: Manage All Your Stock Portfolios in One Place
We've created the ultimate portfolio companion for stock investors, and it's free.
• Connect an unlimited number of Portfolios and see your total in one currency
• Be alerted to new Warning Signs or Risks via email or mobile
• Track the Fair Value of your stocks
Have feedback on this article? Concerned about the content? Get in touch with us directly. Alternatively, email editorial-team (at) simplywallst.com.
This article by Simply Wall St is general in nature. We provide commentary based on historical data and analyst forecasts only using an unbiased methodology and our articles are not intended to be financial advice. It does not constitute a recommendation to buy or sell any stock, and does not take account of your objectives, or your financial situation. We aim to bring you long-term focused analysis driven by fundamental data. Note that our analysis may not factor in the latest price-sensitive company announcements or qualitative material. Simply Wall St has no position in any stocks mentioned.
About NYSE:SEI
Solaris Energy Infrastructure
Provides mobile and scalable equipment-based solutions for use in distributed power generation and management of raw materials used in the completion of oil and natural gas wells in the United States.
Exceptional growth potential with proven track record.
Similar Companies
Market Insights

Advertisement
Community Narratives
MicroVision will explode future revenue by 380.37% with a vision towards success
Fair Value US$60.00|98.4% undervalued
TH
Community Contributor
The Indispensable Artery for a New North American Economy
Fair Value CA$132.87|1.3% undervalued
TI
Community Contributor