Advertisement
- United States
- /
- Oil and Gas
- /
- NYSE:OXY
Does Occidental Petroleum’s Recent 7% Drop Signal a Rebound Opportunity for 2025?

Simply Wall St
Reviewed by Bailey Pemberton
If you follow energy stocks, you've probably given at least a passing glance to Occidental Petroleum lately. With shares closing at $41.88 most recently, you might be wondering if the current price reflects a bargain or if there’s still turbulence ahead. Over the past week, Occidental fell 7.0%, and it’s lost nearly 16% year-to-date. The one-year return stands at -16.6%, which may look gloomy, but let’s not overlook some context. The five-year return is a stunning 357.7%, rewarding those who held on through the cycles and the headlines.
Those big swings in the stock price haven’t happened in a vacuum. Occidental has been navigating a shifting oil market, which has seen both supply anxieties and changing global demand. At the same time, investors have started rethinking risk and reward across the energy sector, balancing optimism about carbon management initiatives with caution about traditional oil exposures. The net effect is that market sentiment has been swinging sharply, translating directly into recent price moves like what we’ve seen this month.
Given this volatile backdrop, it’s more important than ever to ground your decision-making in solid valuation metrics. By the numbers, Occidental scores a 4 out of 6 on our valuation scorecard, meaning it passes 4 of the 6 major undervaluation tests. This is where we dig in: which valuation methods does Occidental shine on, and where are there red flags? Let’s break down the approaches commonly used by investors and see what they reveal about the stock’s true worth. And before you make your final call, I’ll share an even better way to cut through the noise and gauge value at the end of the article.
Why Occidental Petroleum is lagging behind its peers
Approach 1: Occidental Petroleum Discounted Cash Flow (DCF) Analysis
A Discounted Cash Flow (DCF) model estimates a company’s intrinsic value by projecting its future cash flows and then discounting those projections back to today’s dollars. For Occidental Petroleum, the DCF approach starts by looking at current and expected Free Cash Flow (FCF) generation, which is a crucial indicator for investors interested in the company’s fundamental value.
Right now, Occidental’s latest twelve-month Free Cash Flow stands at $5.6 billion. Analysts provide explicit projections for the next five years, with FCF estimates for 2026 around $5.0 billion and up to roughly $5.7 billion by 2028. After that, projections through 2035 rely on trend-based estimates, reaching about $5.4 billion to $5.7 billion per year as extrapolated by Simply Wall St. This pattern suggests steady cash generation, driven by the company’s position in the oil and gas sector.
Based on this DCF methodology, Occidental Petroleum’s intrinsic value is estimated at $102 per share. Compared to the current share price near $41.88, the DCF model indicates the stock is about 58.9% undervalued. This notable discount suggests the market may be overlooking Occidental’s true cash-generating capacity.
Result: UNDERVALUED
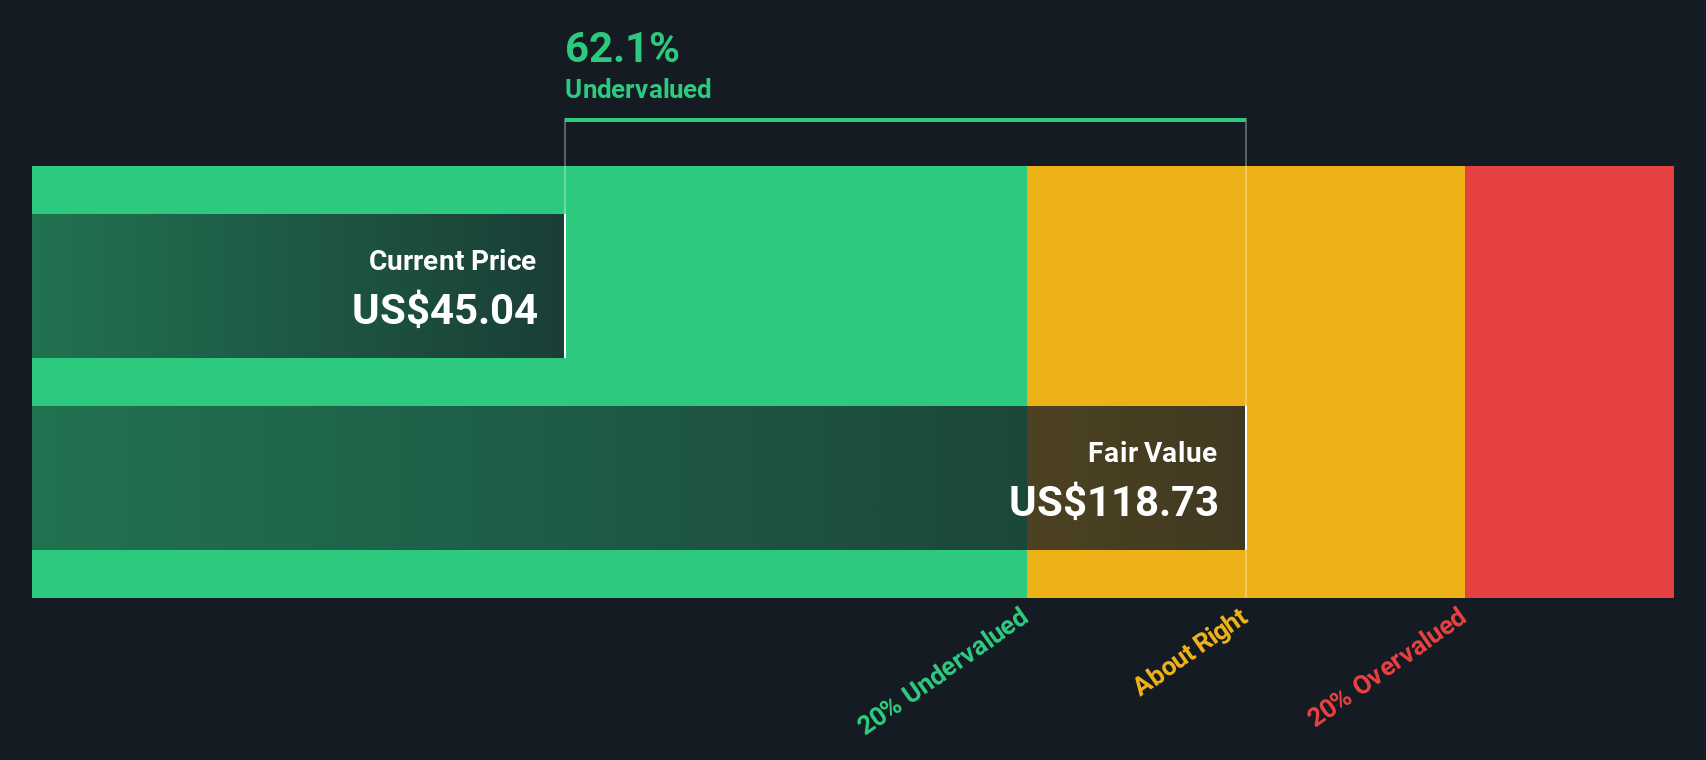
Our Discounted Cash Flow (DCF) analysis suggests Occidental Petroleum is undervalued by 58.9%. Track this in your watchlist or portfolio, or discover more undervalued stocks.
Approach 2: Occidental Petroleum Price vs Earnings
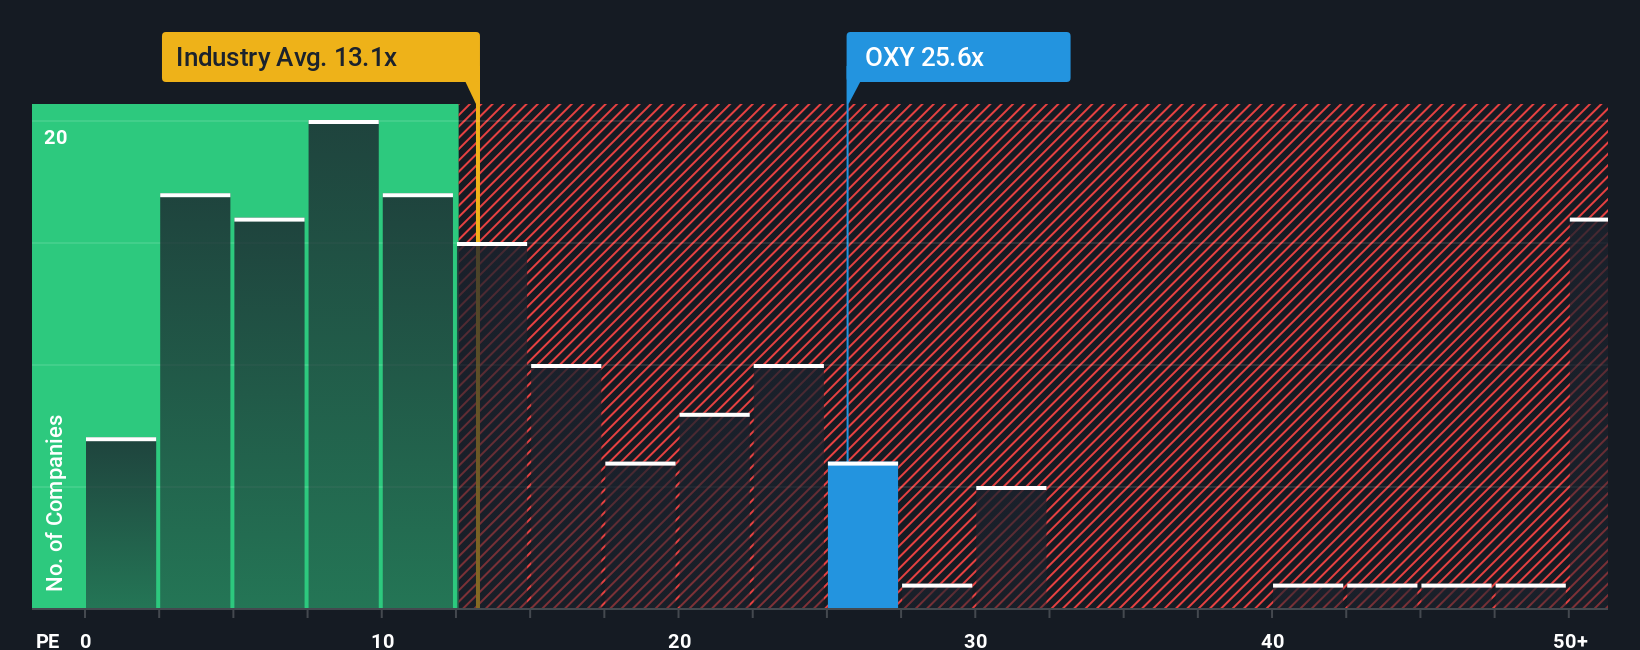
When evaluating established and profitable companies like Occidental Petroleum, the Price-to-Earnings (PE) ratio is a widely used metric. It tells you how much investors are willing to pay per dollar of earnings, making it a go-to gauge for comparing stocks with steady profits. The “right” PE ratio, though, depends heavily on a company’s growth prospects and perceived risk. High-growth, low-risk businesses tend to command premium multiples, while riskier or slower-growing firms typically trade at lower ratios.
Occidental Petroleum's current PE ratio stands at 23.8x. This is well above the oil and gas industry average of 13.1x, but sits below the average of direct peers, which is at 31.2x. On its own, this positioning means Occidental is priced higher than many industry players but remains lower than its most comparable peers.
To find a more tailored benchmark, we turn to Simply Wall St’s proprietary “Fair Ratio,” calculated by weighing factors such as Occidental’s growth outlook, risk profile, profit margins, industry context, and market cap. This offers a more nuanced approach than simply comparing the company against blanket industry or peer averages, which can miss critical company-specific details. In Occidental’s case, the Fair Ratio is 20.6x. Comparing this to the actual PE of 23.8x suggests the stock is a bit pricier than what these factors would typically justify.
Result: OVERVALUED
PE ratios tell one story, but what if the real opportunity lies elsewhere? Discover companies where insiders are betting big on explosive growth.
Upgrade Your Decision Making: Choose your Occidental Petroleum Narrative
Earlier, we mentioned that there’s an even better way to judge a stock’s value. Let’s introduce you to Narratives. A Narrative is your personalized story about a company. It connects your beliefs about Occidental Petroleum’s prospects to specific financial numbers, like your estimates for future revenues, profit margins, and what you think is a fair price. Narratives take the numbers behind valuation and add context, helping you see clearly how a company’s journey and expected performance translate to its fair value right now.
On Simply Wall St’s Community page, millions of investors use Narratives as a simple, accessible tool to track their investment thesis, compare their fair value to the current price, and see instantly whether their story signals a buy or a sell. Narratives automatically stay up to date when new results or major news hits, so your view never lags behind reality. For example, one Narrative on Occidental projects a fair value of $64 per share based on rapid expansion in carbon capture and margin improvement. Another conservatively sets fair value near $40, citing ongoing oil market risks and capital intensity. Narratives help you anchor your decision to real numbers and adapt as the story unfolds.
Do you think there's more to the story for Occidental Petroleum? Create your own Narrative to let the Community know!
This article by Simply Wall St is general in nature. We provide commentary based on historical data and analyst forecasts only using an unbiased methodology and our articles are not intended to be financial advice. It does not constitute a recommendation to buy or sell any stock, and does not take account of your objectives, or your financial situation. We aim to bring you long-term focused analysis driven by fundamental data. Note that our analysis may not factor in the latest price-sensitive company announcements or qualitative material. Simply Wall St has no position in any stocks mentioned.
New: AI Stock Screener & Alerts
Our new AI Stock Screener scans the market every day to uncover opportunities.
• Dividend Powerhouses (3%+ Yield)
• Undervalued Small Caps with Insider Buying
• High growth Tech and AI Companies
Or build your own from over 50 metrics.
Have feedback on this article? Concerned about the content? Get in touch with us directly. Alternatively, email editorial-team@simplywallst.com
About NYSE:OXY
Occidental Petroleum
Engages in the acquisition, exploration, and development of oil and gas properties in the United States and internationally.
Adequate balance sheet with slight risk.
Similar Companies
Market Insights

Advertisement
Community Narratives
Finding The True Value Of A Logistics Powerhouse
Fair Value US$95.21|8.4% undervalued
NV
Community Contributor
Paradigm Biopharmaceuticals Will Lead Osteoarthritis Treatment with Zilosul's FDA Success
Fair Value AU$5.50|92.1% undervalued
AM
Community Contributor
Barrick Mining (ABX:CA): A Gold Hedge against a U.S. Shutdown
Fair Value CA$60.00|24.2% undervalued
GM
Community Contributor