
Advertisement
- United States
- /
- Energy Services
- /
- NYSE:OII
The Return Trends At Oceaneering International (NYSE:OII) Look Promising
Did you know there are some financial metrics that can provide clues of a potential multi-bagger? One common approach is to try and find a company with returns on capital employed (ROCE) that are increasing, in conjunction with a growing amount of capital employed. If you see this, it typically means it's a company with a great business model and plenty of profitable reinvestment opportunities. With that in mind, we've noticed some promising trends at Oceaneering International (NYSE:OII) so let's look a bit deeper.
What Is Return On Capital Employed (ROCE)?
Just to clarify if you're unsure, ROCE is a metric for evaluating how much pre-tax income (in percentage terms) a company earns on the capital invested in its business. To calculate this metric for Oceaneering International, this is the formula:
Return on Capital Employed = Earnings Before Interest and Tax (EBIT) ÷ (Total Assets - Current Liabilities)
0.12 = US$176m ÷ (US$2.3b - US$800m) (Based on the trailing twelve months to September 2023).
So, Oceaneering International has an ROCE of 12%. By itself that's a normal return on capital and it's in line with the industry's average returns of 12%.
View our latest analysis for Oceaneering International
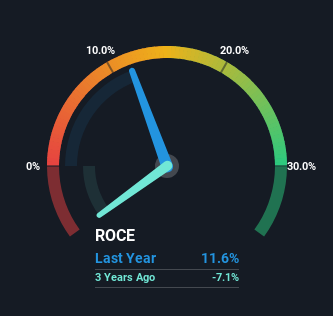
Above you can see how the current ROCE for Oceaneering International compares to its prior returns on capital, but there's only so much you can tell from the past. If you're interested, you can view the analysts predictions in our free report on analyst forecasts for the company.
The Trend Of ROCE
It's great to see that Oceaneering International has started to generate some pre-tax earnings from prior investments. The company was generating losses five years ago, but now it's turned around, earning 12% which is no doubt a relief for some early shareholders. In regards to capital employed, Oceaneering International is using 38% less capital than it was five years ago, which on the surface, can indicate that the business has become more efficient at generating these returns. The reduction could indicate that the company is selling some assets, and considering returns are up, they appear to be selling the right ones.
For the record though, there was a noticeable increase in the company's current liabilities over the period, so we would attribute some of the ROCE growth to that. Effectively this means that suppliers or short-term creditors are now funding 35% of the business, which is more than it was five years ago. It's worth keeping an eye on this because as the percentage of current liabilities to total assets increases, some aspects of risk also increase.
The Bottom Line On Oceaneering International's ROCE
In summary, it's great to see that Oceaneering International has been able to turn things around and earn higher returns on lower amounts of capital. And investors seem to expect more of this going forward, since the stock has rewarded shareholders with a 41% return over the last five years. So given the stock has proven it has promising trends, it's worth researching the company further to see if these trends are likely to persist.
On the other side of ROCE, we have to consider valuation. That's why we have a FREE intrinsic value estimation on our platform that is definitely worth checking out.
If you want to search for solid companies with great earnings, check out this free list of companies with good balance sheets and impressive returns on equity.
New: AI Stock Screener & Alerts
Our new AI Stock Screener scans the market every day to uncover opportunities.
• Dividend Powerhouses (3%+ Yield)
• Undervalued Small Caps with Insider Buying
• High growth Tech and AI Companies
Or build your own from over 50 metrics.
Have feedback on this article? Concerned about the content? Get in touch with us directly. Alternatively, email editorial-team (at) simplywallst.com.
This article by Simply Wall St is general in nature. We provide commentary based on historical data and analyst forecasts only using an unbiased methodology and our articles are not intended to be financial advice. It does not constitute a recommendation to buy or sell any stock, and does not take account of your objectives, or your financial situation. We aim to bring you long-term focused analysis driven by fundamental data. Note that our analysis may not factor in the latest price-sensitive company announcements or qualitative material. Simply Wall St has no position in any stocks mentioned.
About NYSE:OII
Oceaneering International
Provides engineered services and products, and robotic solutions to the offshore energy, defense, aerospace, manufacturing, and entertainment industries in the United States, Africa, the United Kingdom, Norway, Brazil, Asia, Australia, and internationally.
Flawless balance sheet with solid track record.
Similar Companies
Market Insights

Advertisement
Community Narratives
MicroVision will explode future revenue by 380.37% with a vision towards success
Fair Value US$60.00|98.4% undervalued
TH
Community Contributor
The Indispensable Artery for a New North American Economy
Fair Value CA$132.87|1.1% undervalued
TI
Community Contributor