Stock Analysis
- United States
- /
- Oil and Gas
- /
- NYSE:EQT
While shareholders of EQT (NYSE:EQT) are in the black over 5 years, those who bought a week ago aren't so fortunate


The worst result, after buying shares in a company (assuming no leverage), would be if you lose all the money you put in. But on a lighter note, a good company can see its share price rise well over 100%. For example, the EQT Corporation (NYSE:EQT) share price has soared 134% in the last half decade. Most would be very happy with that. It's down 6.0% in the last seven days.
While the stock has fallen 6.0% this week, it's worth focusing on the longer term and seeing if the stocks historical returns have been driven by the underlying fundamentals.
View our latest analysis for EQT
In his essay The Superinvestors of Graham-and-Doddsville Warren Buffett described how share prices do not always rationally reflect the value of a business. One way to examine how market sentiment has changed over time is to look at the interaction between a company's share price and its earnings per share (EPS).
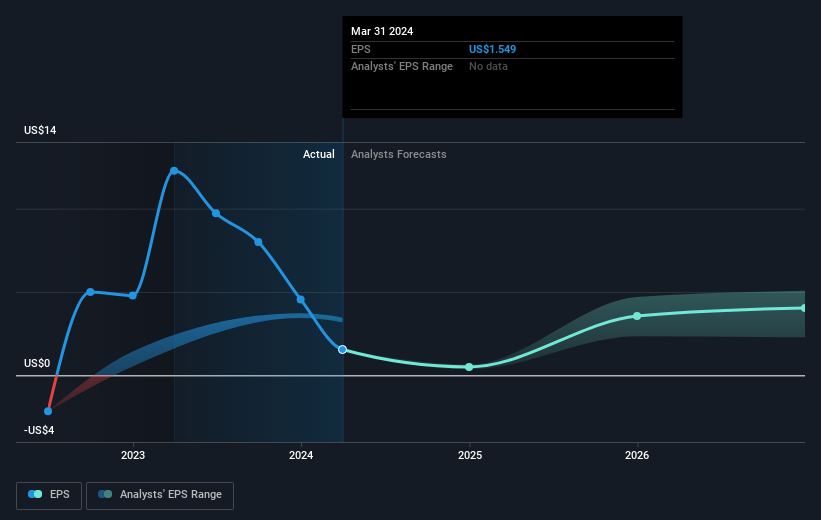
During the last half decade, EQT became profitable. That kind of transition can be an inflection point that justifies a strong share price gain, just as we have seen here.
You can see below how EPS has changed over time (discover the exact values by clicking on the image).
We know that EQT has improved its bottom line over the last three years, but what does the future have in store? Take a more thorough look at EQT's financial health with this free report on its balance sheet.
What About Dividends?
When looking at investment returns, it is important to consider the difference between total shareholder return (TSR) and share price return. The TSR is a return calculation that accounts for the value of cash dividends (assuming that any dividend received was reinvested) and the calculated value of any discounted capital raisings and spin-offs. So for companies that pay a generous dividend, the TSR is often a lot higher than the share price return. As it happens, EQT's TSR for the last 5 years was 146%, which exceeds the share price return mentioned earlier. This is largely a result of its dividend payments!
A Different Perspective
While the broader market gained around 26% in the last year, EQT shareholders lost 4.1% (even including dividends). Even the share prices of good stocks drop sometimes, but we want to see improvements in the fundamental metrics of a business, before getting too interested. On the bright side, long term shareholders have made money, with a gain of 20% per year over half a decade. It could be that the recent sell-off is an opportunity, so it may be worth checking the fundamental data for signs of a long term growth trend. I find it very interesting to look at share price over the long term as a proxy for business performance. But to truly gain insight, we need to consider other information, too. Even so, be aware that EQT is showing 5 warning signs in our investment analysis , you should know about...
For those who like to find winning investments this free list of undervalued companies with recent insider purchasing, could be just the ticket.
Please note, the market returns quoted in this article reflect the market weighted average returns of stocks that currently trade on American exchanges.
Valuation is complex, but we're helping make it simple.
Find out whether EQT is potentially over or undervalued by checking out our comprehensive analysis, which includes fair value estimates, risks and warnings, dividends, insider transactions and financial health.
View the Free AnalysisHave feedback on this article? Concerned about the content? Get in touch with us directly. Alternatively, email editorial-team (at) simplywallst.com.
This article by Simply Wall St is general in nature. We provide commentary based on historical data and analyst forecasts only using an unbiased methodology and our articles are not intended to be financial advice. It does not constitute a recommendation to buy or sell any stock, and does not take account of your objectives, or your financial situation. We aim to bring you long-term focused analysis driven by fundamental data. Note that our analysis may not factor in the latest price-sensitive company announcements or qualitative material. Simply Wall St has no position in any stocks mentioned.
Valuation is complex, but we're helping make it simple.
Find out whether EQT is potentially over or undervalued by checking out our comprehensive analysis, which includes fair value estimates, risks and warnings, dividends, insider transactions and financial health.
View the Free AnalysisHave feedback on this article? Concerned about the content? Get in touch with us directly. Alternatively, email editorial-team@simplywallst.com
About NYSE:EQT
Reasonable growth potential with adequate balance sheet and pays a dividend.
