Advertisement
- United States
- /
- Oil and Gas
- /
- NYSE:EQT
Is Now the Right Moment for EQT Shares After Natural Gas Price Rally?

Simply Wall St
Reviewed by Bailey Pemberton
If you have been following EQT lately, you might be wondering what all the buzz is about and whether it is time to jump in, stay put, or take some chips off the table. The stock closed at $54.08 most recently, boasting a year-to-date return of 14.2% and an impressive 50.2% gain over the past year. Even zooming out, its five-year climb stands at 255.4%. That is the kind of performance that gets noticed. A modest 1.8% increase in the last week and 8.2% for the last month suggest steady positive sentiment, bolstered by broader trends in the energy market that have continued to reshape how investors perceive future opportunities and risk in the sector.
But these strong returns naturally raise the big question: With so much momentum, is EQT still a good value, or has the ship already sailed? That is where a closer look at valuation comes in. On a scale from 0 to 6, EQT’s valuation score clocks in at 3, which means it is considered undervalued in half of the key tests. Up next, we will unpack these different valuation checks to see where EQT stands. I will also share an even more insightful angle on the company’s true worth later on, so stay tuned.
Approach 1: EQT Discounted Cash Flow (DCF) Analysis
A Discounted Cash Flow (DCF) model estimates a company's intrinsic value by forecasting its future cash flows and discounting them back to today, reflecting both growth expectations and present risk. For EQT, this approach uses projected Free Cash Flow (FCF), beginning with the company's latest available trailing twelve month FCF of $2.23 billion.
Analyst estimates suggest EQT’s annual free cash flow will grow significantly in the coming years. By 2029, forecasts project FCF to reach $3.35 billion, with incremental growth expected into the next decade. Notably, analysts directly supply projections only out to 2029. Numbers beyond that are extrapolated to provide a complete long-term picture.
After discounting these future cash flows to their present value, the model arrives at an intrinsic value of $108.11 per share for EQT, effectively double its recent market price of $54.08. This result implies the stock is trading with a 50.0% discount relative to its estimated fair value.
In sum, the DCF analysis suggests EQT is substantially undervalued by the market today when measured against its long-run cash generating potential.
Result: UNDERVALUED
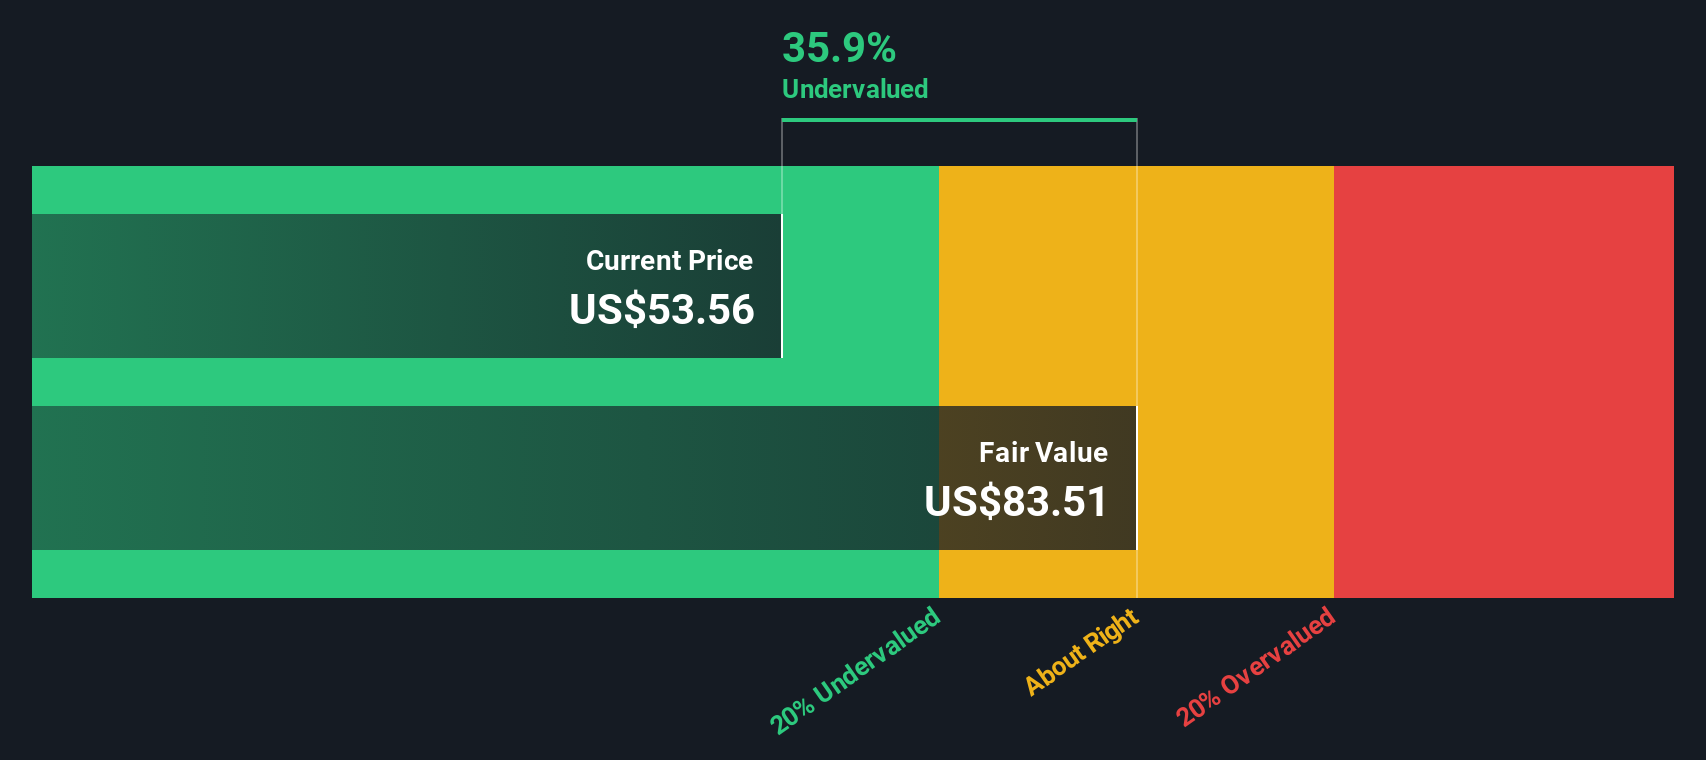
Our Discounted Cash Flow (DCF) analysis suggests EQT is undervalued by 50.0%. Track this in your watchlist or portfolio, or discover more undervalued stocks.
Approach 2: EQT Price vs Earnings
For profitable companies like EQT, the price-to-earnings (PE) ratio is often the most relevant valuation metric, as it reflects how much investors are willing to pay today for a dollar of the company’s earnings. A company’s PE ratio is shaped by growth prospects and risk. Higher expected future growth or lower business risk can justify a higher “normal” or “fair” PE multiple, while slower growth or greater uncertainty typically leads to lower multiples.
EQT currently trades at a PE ratio of 29.5x. When stacked against the Oil and Gas industry average of 12.6x and the peer group average of 36.1x, EQT sits between these benchmarks: much higher than the industry overall, but a bit below comparable peers. This highlights the market's recognition of EQT’s stronger earnings profile, but also its sensitivity to the broader peer group’s valuation.
However, simply comparing to industry and peer averages ignores key aspects like EQT’s earnings growth outlook, risk profile, profit margins, and market cap. To address this, Simply Wall St has developed a proprietary “Fair Ratio.” For EQT, this Fair Ratio is 21.8x, reflecting an ideal multiple the market would typically assign based on all those factors, not just sector averages.
Using the Fair Ratio offers a more nuanced perspective than the blunt force of industry benchmarks. It accounts for company-specific fundamentals, such as future earnings growth, the quality of those earnings, the company’s risk level, and its standing in the market. This makes it a more reliable guide for investors navigating complex valuation decisions.
Comparing EQT’s current PE of 29.5x to its Fair Ratio of 21.8x suggests that the stock is trading at a premium to where it “should” be, based on fundamentals. This points to the stock being a bit expensive relative to its underlying drivers.
Result: OVERVALUED

PE ratios tell one story, but what if the real opportunity lies elsewhere? Discover companies where insiders are betting big on explosive growth.
Upgrade Your Decision Making: Choose your EQT Narrative
Earlier we mentioned that there is an even better way to understand valuation. Let us introduce you to Narratives. A Narrative is simply your story about a company, summarizing your personal assumptions about its future, such as revenue growth, profit margins, or the risks you expect, along with your estimated fair value. Narratives link what you believe about EQT’s business and its prospects directly to a forward-looking financial forecast, showing you what the company might really be worth based on your viewpoint.
Narratives are accessible and easy to use on Simply Wall St’s Community page, where millions of investors share, discuss, and update their perspectives. This tool helps you make smarter decisions, letting you compare your calculated fair value against the current share price to decide when to buy or sell, rather than just following industry averages. Best of all, Narratives stay current and automatically update as fresh news or earnings emerge, so your view evolves as the facts do.
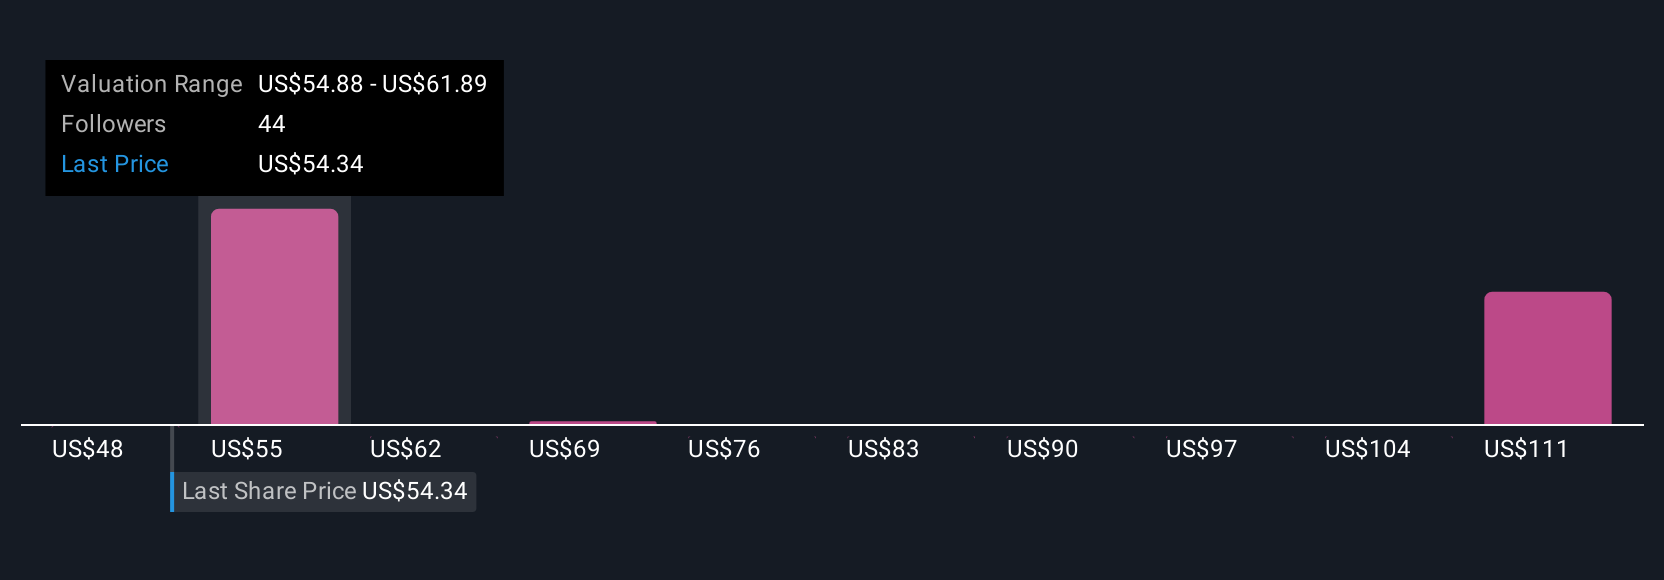
For example, some investors now expect EQT’s price to reach as high as $80 if upstream growth and exports surge. Others are more cautious with targets near $42 due to regulatory or market risks. Your Narrative lets you clearly state and quantify your viewpoint.
Do you think there's more to the story for EQT? Create your own Narrative to let the Community know!
This article by Simply Wall St is general in nature. We provide commentary based on historical data and analyst forecasts only using an unbiased methodology and our articles are not intended to be financial advice. It does not constitute a recommendation to buy or sell any stock, and does not take account of your objectives, or your financial situation. We aim to bring you long-term focused analysis driven by fundamental data. Note that our analysis may not factor in the latest price-sensitive company announcements or qualitative material. Simply Wall St has no position in any stocks mentioned.
Valuation is complex, but we're here to simplify it.
Discover if EQT might be undervalued or overvalued with our detailed analysis, featuring fair value estimates, potential risks, dividends, insider trades, and its financial condition.
Access Free AnalysisHave feedback on this article? Concerned about the content? Get in touch with us directly. Alternatively, email editorial-team@simplywallst.com
About NYSE:EQT
EQT
Engages in the production, gathering, and transmission of natural gas.
Solid track record with adequate balance sheet.
Similar Companies
Market Insights

Advertisement
Community Narratives
Kodiak AI - a potential 100 bagger opportunity?
Fair Value US$14.00|44.7% undervalued
DA
Community Contributor
A Fair Price for a Great Business Facing Real Threats
Fair Value US$383.06|13.0% undervalued
IM
Community Contributor
AXON And Shopify Integration Will Unlock Global Mobile Advertising
Fair Value US$646.30|0% overvalued
AN
Based on Analyst Price Targets