- United States
- /
- Oil and Gas
- /
- NYSE:ENLC
Calculating The Intrinsic Value Of EnLink Midstream, LLC (NYSE:ENLC)


Key Insights
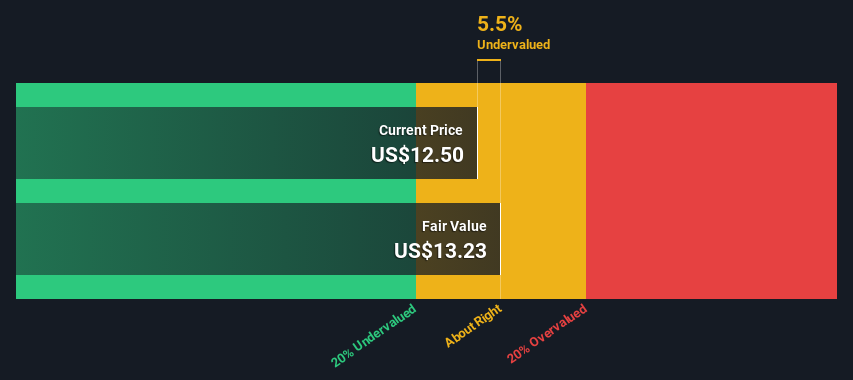
- Using the 2 Stage Free Cash Flow to Equity, EnLink Midstream fair value estimate is US$13.23
- Current share price of US$12.50 suggests EnLink Midstream is potentially trading close to its fair value
- Our fair value estimate is 6.7% lower than EnLink Midstream's analyst price target of US$14.18
In this article we are going to estimate the intrinsic value of EnLink Midstream, LLC (NYSE:ENLC) by estimating the company's future cash flows and discounting them to their present value. We will take advantage of the Discounted Cash Flow (DCF) model for this purpose. Believe it or not, it's not too difficult to follow, as you'll see from our example!
Companies can be valued in a lot of ways, so we would point out that a DCF is not perfect for every situation. If you want to learn more about discounted cash flow, the rationale behind this calculation can be read in detail in the Simply Wall St analysis model.
See our latest analysis for EnLink Midstream
Crunching The Numbers
We're using the 2-stage growth model, which simply means we take in account two stages of company's growth. In the initial period the company may have a higher growth rate and the second stage is usually assumed to have a stable growth rate. In the first stage we need to estimate the cash flows to the business over the next ten years. Where possible we use analyst estimates, but when these aren't available we extrapolate the previous free cash flow (FCF) from the last estimate or reported value. We assume companies with shrinking free cash flow will slow their rate of shrinkage, and that companies with growing free cash flow will see their growth rate slow, over this period. We do this to reflect that growth tends to slow more in the early years than it does in later years.
Generally we assume that a dollar today is more valuable than a dollar in the future, so we need to discount the sum of these future cash flows to arrive at a present value estimate:
10-year free cash flow (FCF) estimate
| 2024 | 2025 | 2026 | 2027 | 2028 | 2029 | 2030 | 2031 | 2032 | 2033 | |
| Levered FCF ($, Millions) | US$488.1m | US$634.9m | US$710.0m | US$759.0m | US$524.9m | US$512.7m | US$507.7m | US$507.6m | US$511.0m | US$516.7m |
| Growth Rate Estimate Source | Analyst x3 | Analyst x2 | Analyst x2 | Analyst x2 | Analyst x1 | Est @ -2.33% | Est @ -0.97% | Est @ -0.01% | Est @ 0.66% | Est @ 1.13% |
| Present Value ($, Millions) Discounted @ 10% | US$443 | US$523 | US$531 | US$515 | US$323 | US$287 | US$258 | US$234 | US$214 | US$196 |
("Est" = FCF growth rate estimated by Simply Wall St)
Present Value of 10-year Cash Flow (PVCF) = US$3.5b
The second stage is also known as Terminal Value, this is the business's cash flow after the first stage. For a number of reasons a very conservative growth rate is used that cannot exceed that of a country's GDP growth. In this case we have used the 5-year average of the 10-year government bond yield (2.2%) to estimate future growth. In the same way as with the 10-year 'growth' period, we discount future cash flows to today's value, using a cost of equity of 10%.
Terminal Value (TV)= FCF2033 × (1 + g) ÷ (r – g) = US$517m× (1 + 2.2%) ÷ (10%– 2.2%) = US$6.6b
Present Value of Terminal Value (PVTV)= TV / (1 + r)10= US$6.6b÷ ( 1 + 10%)10= US$2.5b
The total value, or equity value, is then the sum of the present value of the future cash flows, which in this case is US$6.0b. To get the intrinsic value per share, we divide this by the total number of shares outstanding. Relative to the current share price of US$12.5, the company appears about fair value at a 5.5% discount to where the stock price trades currently. Remember though, that this is just an approximate valuation, and like any complex formula - garbage in, garbage out.
Important Assumptions
Now the most important inputs to a discounted cash flow are the discount rate, and of course, the actual cash flows. Part of investing is coming up with your own evaluation of a company's future performance, so try the calculation yourself and check your own assumptions. The DCF also does not consider the possible cyclicality of an industry, or a company's future capital requirements, so it does not give a full picture of a company's potential performance. Given that we are looking at EnLink Midstream as potential shareholders, the cost of equity is used as the discount rate, rather than the cost of capital (or weighted average cost of capital, WACC) which accounts for debt. In this calculation we've used 10%, which is based on a levered beta of 1.590. Beta is a measure of a stock's volatility, compared to the market as a whole. We get our beta from the industry average beta of globally comparable companies, with an imposed limit between 0.8 and 2.0, which is a reasonable range for a stable business.
SWOT Analysis for EnLink Midstream
- Earnings growth over the past year exceeded the industry.
- Debt is well covered by cash flow.
- Dividends are covered by earnings and cash flows.
- Earnings growth over the past year is below its 5-year average.
- Interest payments on debt are not well covered.
- Dividend is low compared to the top 25% of dividend payers in the Oil and Gas market.
- Annual revenue is forecast to grow faster than the American market.
- Current share price is below our estimate of fair value.
- Annual earnings are forecast to grow slower than the American market.
Next Steps:
Valuation is only one side of the coin in terms of building your investment thesis, and it shouldn't be the only metric you look at when researching a company. DCF models are not the be-all and end-all of investment valuation. Instead the best use for a DCF model is to test certain assumptions and theories to see if they would lead to the company being undervalued or overvalued. For example, changes in the company's cost of equity or the risk free rate can significantly impact the valuation. For EnLink Midstream, there are three essential aspects you should explore:
- Risks: Take risks, for example - EnLink Midstream has 2 warning signs (and 1 which is significant) we think you should know about.
- Future Earnings: How does ENLC's growth rate compare to its peers and the wider market? Dig deeper into the analyst consensus number for the upcoming years by interacting with our free analyst growth expectation chart.
- Other High Quality Alternatives: Do you like a good all-rounder? Explore our interactive list of high quality stocks to get an idea of what else is out there you may be missing!
PS. The Simply Wall St app conducts a discounted cash flow valuation for every stock on the NYSE every day. If you want to find the calculation for other stocks just search here.
Valuation is complex, but we're here to simplify it.
Discover if EnLink Midstream might be undervalued or overvalued with our detailed analysis, featuring fair value estimates, potential risks, dividends, insider trades, and its financial condition.
Access Free AnalysisHave feedback on this article? Concerned about the content? Get in touch with us directly. Alternatively, email editorial-team (at) simplywallst.com.
This article by Simply Wall St is general in nature. We provide commentary based on historical data and analyst forecasts only using an unbiased methodology and our articles are not intended to be financial advice. It does not constitute a recommendation to buy or sell any stock, and does not take account of your objectives, or your financial situation. We aim to bring you long-term focused analysis driven by fundamental data. Note that our analysis may not factor in the latest price-sensitive company announcements or qualitative material. Simply Wall St has no position in any stocks mentioned.
About NYSE:ENLC
EnLink Midstream
Provides midstream energy services in the United States.
High growth potential slight.

