
Advertisement
- United States
- /
- Oil and Gas
- /
- NYSE:CVX
Investors in Chevron (NYSE:CVX) have seen favorable returns of 57% over the past three years
By buying an index fund, you can roughly match the market return with ease. But many of us dare to dream of bigger returns, and build a portfolio ourselves. For example, the Chevron Corporation (NYSE:CVX) share price is up 39% in the last three years, clearly besting the market return of around 20% (not including dividends).
Now it's worth having a look at the company's fundamentals too, because that will help us determine if the long term shareholder return has matched the performance of the underlying business.
See our latest analysis for Chevron
While markets are a powerful pricing mechanism, share prices reflect investor sentiment, not just underlying business performance. One imperfect but simple way to consider how the market perception of a company has shifted is to compare the change in the earnings per share (EPS) with the share price movement.
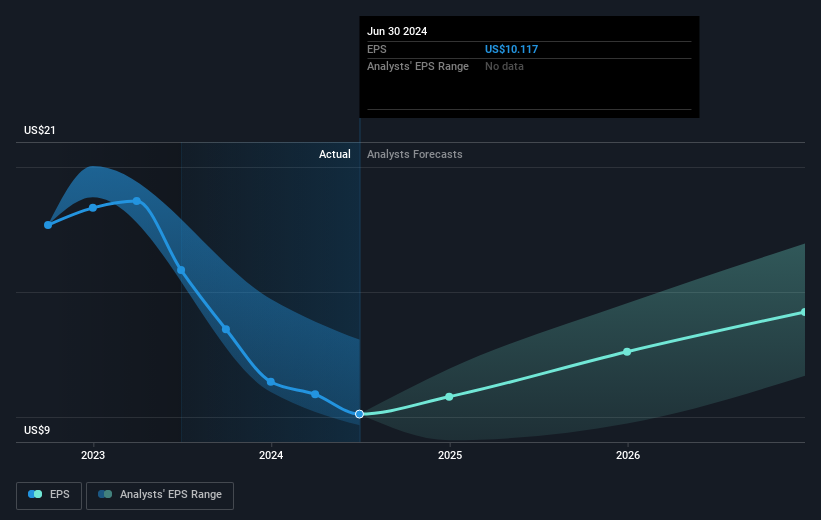
During three years of share price growth, Chevron achieved compound earnings per share growth of 76% per year. This EPS growth is higher than the 12% average annual increase in the share price. So it seems investors have become more cautious about the company, over time.
You can see below how EPS has changed over time (discover the exact values by clicking on the image).
It is of course excellent to see how Chevron has grown profits over the years, but the future is more important for shareholders. This free interactive report on Chevron's balance sheet strength is a great place to start, if you want to investigate the stock further.
What About Dividends?
It is important to consider the total shareholder return, as well as the share price return, for any given stock. The TSR incorporates the value of any spin-offs or discounted capital raisings, along with any dividends, based on the assumption that the dividends are reinvested. It's fair to say that the TSR gives a more complete picture for stocks that pay a dividend. As it happens, Chevron's TSR for the last 3 years was 57%, which exceeds the share price return mentioned earlier. This is largely a result of its dividend payments!
A Different Perspective
Chevron shareholders are down 10.0% for the year (even including dividends), but the market itself is up 34%. Even the share prices of good stocks drop sometimes, but we want to see improvements in the fundamental metrics of a business, before getting too interested. Longer term investors wouldn't be so upset, since they would have made 10%, each year, over five years. It could be that the recent sell-off is an opportunity, so it may be worth checking the fundamental data for signs of a long term growth trend. It's always interesting to track share price performance over the longer term. But to understand Chevron better, we need to consider many other factors. Case in point: We've spotted 1 warning sign for Chevron you should be aware of.
Of course, you might find a fantastic investment by looking elsewhere. So take a peek at this free list of companies we expect will grow earnings.
Please note, the market returns quoted in this article reflect the market weighted average returns of stocks that currently trade on American exchanges.
New: AI Stock Screener & Alerts
Our new AI Stock Screener scans the market every day to uncover opportunities.
• Dividend Powerhouses (3%+ Yield)
• Undervalued Small Caps with Insider Buying
• High growth Tech and AI Companies
Or build your own from over 50 metrics.
Have feedback on this article? Concerned about the content? Get in touch with us directly. Alternatively, email editorial-team (at) simplywallst.com.
This article by Simply Wall St is general in nature. We provide commentary based on historical data and analyst forecasts only using an unbiased methodology and our articles are not intended to be financial advice. It does not constitute a recommendation to buy or sell any stock, and does not take account of your objectives, or your financial situation. We aim to bring you long-term focused analysis driven by fundamental data. Note that our analysis may not factor in the latest price-sensitive company announcements or qualitative material. Simply Wall St has no position in any stocks mentioned.
About NYSE:CVX
Chevron
Through its subsidiaries, engages in the integrated energy and chemicals operations in the United States and internationally.
6 star dividend payer with excellent balance sheet.
Similar Companies
Market Insights


Advertisement
Community Narratives
A case for TSXV:USA to reach USD $5.00 - $9.00 (CAD $7.30–$12.29) by 2029.
Fair Value CA$12.29|91.2% undervalued
AG
Community Contributor
DLocal's Future Growth Fueled by 35% Revenue and Profit Margin Boosts
Fair Value US$195.39|94.1% undervalued
WY
Community Contributor
Historically Cheap, but the Margin of Safety Is Still Thin
Fair Value SEK 232.58|12.7% undervalued
MA
Community Contributor