
Advertisement
- United States
- /
- Energy Services
- /
- NYSE:AESI
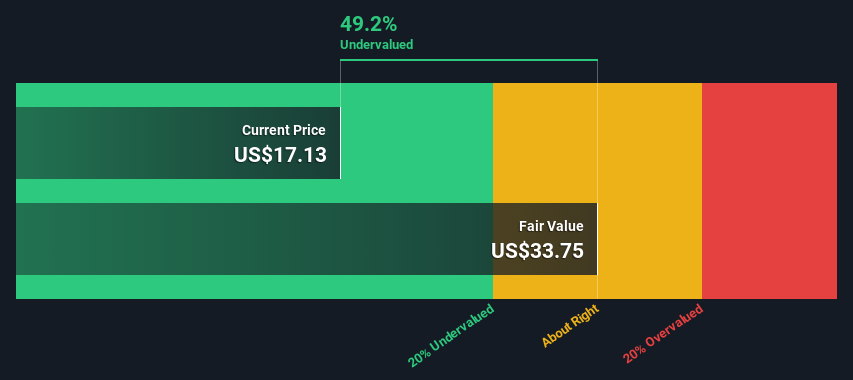
Atlas Energy Solutions Inc. (NYSE:AESI) Shares Could Be 49% Below Their Intrinsic Value Estimate
Key Insights
- Using the 2 Stage Free Cash Flow to Equity, Atlas Energy Solutions fair value estimate is US$33.75
- Current share price of US$17.13 suggests Atlas Energy Solutions is potentially 49% undervalued
- Our fair value estimate is 43% higher than Atlas Energy Solutions' analyst price target of US$23.60
Today we'll do a simple run through of a valuation method used to estimate the attractiveness of Atlas Energy Solutions Inc. (NYSE:AESI) as an investment opportunity by taking the expected future cash flows and discounting them to their present value. This will be done using the Discounted Cash Flow (DCF) model. Before you think you won't be able to understand it, just read on! It's actually much less complex than you'd imagine.
Companies can be valued in a lot of ways, so we would point out that a DCF is not perfect for every situation. For those who are keen learners of equity analysis, the Simply Wall St analysis model here may be something of interest to you.
Check out our latest analysis for Atlas Energy Solutions
What's The Estimated Valuation?
We use what is known as a 2-stage model, which simply means we have two different periods of growth rates for the company's cash flows. Generally the first stage is higher growth, and the second stage is a lower growth phase. To begin with, we have to get estimates of the next ten years of cash flows. Where possible we use analyst estimates, but when these aren't available we extrapolate the previous free cash flow (FCF) from the last estimate or reported value. We assume companies with shrinking free cash flow will slow their rate of shrinkage, and that companies with growing free cash flow will see their growth rate slow, over this period. We do this to reflect that growth tends to slow more in the early years than it does in later years.
A DCF is all about the idea that a dollar in the future is less valuable than a dollar today, and so the sum of these future cash flows is then discounted to today's value:
10-year free cash flow (FCF) estimate
| 2024 | 2025 | 2026 | 2027 | 2028 | 2029 | 2030 | 2031 | 2032 | 2033 | |
| Levered FCF ($, Millions) | US$273.6m | US$365.3m | US$339.8m | US$296.2m | US$272.0m | US$258.3m | US$250.8m | US$247.5m | US$246.8m | US$248.0m |
| Growth Rate Estimate Source | Analyst x2 | Analyst x2 | Analyst x1 | Analyst x1 | Est @ -8.17% | Est @ -5.05% | Est @ -2.87% | Est @ -1.34% | Est @ -0.27% | Est @ 0.47% |
| Present Value ($, Millions) Discounted @ 9.1% | US$251 | US$307 | US$262 | US$209 | US$176 | US$153 | US$136 | US$123 | US$113 | US$104 |
("Est" = FCF growth rate estimated by Simply Wall St)
Present Value of 10-year Cash Flow (PVCF) = US$1.8b
After calculating the present value of future cash flows in the initial 10-year period, we need to calculate the Terminal Value, which accounts for all future cash flows beyond the first stage. The Gordon Growth formula is used to calculate Terminal Value at a future annual growth rate equal to the 5-year average of the 10-year government bond yield of 2.2%. We discount the terminal cash flows to today's value at a cost of equity of 9.1%.
Terminal Value (TV)= FCF2033 × (1 + g) ÷ (r – g) = US$248m× (1 + 2.2%) ÷ (9.1%– 2.2%) = US$3.7b
Present Value of Terminal Value (PVTV)= TV / (1 + r)10= US$3.7b÷ ( 1 + 9.1%)10= US$1.5b
The total value, or equity value, is then the sum of the present value of the future cash flows, which in this case is US$3.4b. In the final step we divide the equity value by the number of shares outstanding. Relative to the current share price of US$17.1, the company appears quite undervalued at a 49% discount to where the stock price trades currently. Remember though, that this is just an approximate valuation, and like any complex formula - garbage in, garbage out.
Important Assumptions
The calculation above is very dependent on two assumptions. The first is the discount rate and the other is the cash flows. If you don't agree with these result, have a go at the calculation yourself and play with the assumptions. The DCF also does not consider the possible cyclicality of an industry, or a company's future capital requirements, so it does not give a full picture of a company's potential performance. Given that we are looking at Atlas Energy Solutions as potential shareholders, the cost of equity is used as the discount rate, rather than the cost of capital (or weighted average cost of capital, WACC) which accounts for debt. In this calculation we've used 9.1%, which is based on a levered beta of 1.376. Beta is a measure of a stock's volatility, compared to the market as a whole. We get our beta from the industry average beta of globally comparable companies, with an imposed limit between 0.8 and 2.0, which is a reasonable range for a stable business.
SWOT Analysis for Atlas Energy Solutions
Strength
- Debt is not viewed as a risk.
Weakness
- Earnings declined over the past year.
- Dividend is low compared to the top 25% of dividend payers in the Energy Services market.
Opportunity
- Annual earnings are forecast to grow faster than the American market.
- Good value based on P/E ratio and estimated fair value.
Threat
- Paying a dividend but company has no free cash flows.
- Revenue is forecast to grow slower than 20% per year.
Looking Ahead:
Whilst important, the DCF calculation shouldn't be the only metric you look at when researching a company. DCF models are not the be-all and end-all of investment valuation. Rather it should be seen as a guide to "what assumptions need to be true for this stock to be under/overvalued?" For instance, if the terminal value growth rate is adjusted slightly, it can dramatically alter the overall result. Can we work out why the company is trading at a discount to intrinsic value? For Atlas Energy Solutions, there are three fundamental items you should look at:
- Risks: For example, we've discovered 4 warning signs for Atlas Energy Solutions (1 is potentially serious!) that you should be aware of before investing here.
- Management:Have insiders been ramping up their shares to take advantage of the market's sentiment for AESI's future outlook? Check out our management and board analysis with insights on CEO compensation and governance factors.
- Other Solid Businesses: Low debt, high returns on equity and good past performance are fundamental to a strong business. Why not explore our interactive list of stocks with solid business fundamentals to see if there are other companies you may not have considered!
PS. Simply Wall St updates its DCF calculation for every American stock every day, so if you want to find the intrinsic value of any other stock just search here.
New: Manage All Your Stock Portfolios in One Place
We've created the ultimate portfolio companion for stock investors, and it's free.
• Connect an unlimited number of Portfolios and see your total in one currency
• Be alerted to new Warning Signs or Risks via email or mobile
• Track the Fair Value of your stocks
Have feedback on this article? Concerned about the content? Get in touch with us directly. Alternatively, email editorial-team (at) simplywallst.com.
This article by Simply Wall St is general in nature. We provide commentary based on historical data and analyst forecasts only using an unbiased methodology and our articles are not intended to be financial advice. It does not constitute a recommendation to buy or sell any stock, and does not take account of your objectives, or your financial situation. We aim to bring you long-term focused analysis driven by fundamental data. Note that our analysis may not factor in the latest price-sensitive company announcements or qualitative material. Simply Wall St has no position in any stocks mentioned.
About NYSE:AESI
Atlas Energy Solutions
Engages in the production, processing, and sale of mesh and sand used as a proppant during the well completion process in the Permian Basin of West Texas and New Mexico.
Good value with moderate growth potential.
Similar Companies
Market Insights

Advertisement
Community Narratives
MicroVision will explode future revenue by 380.37% with a vision towards success
Fair Value US$60.00|98.4% undervalued
TH
Community Contributor
The Indispensable Artery for a New North American Economy
Fair Value CA$132.87|3.6% undervalued
TI
Community Contributor