
Advertisement
- United States
- /
- Oil and Gas
- /
- NasdaqCM:SLNG
Stabilis Solutions, Inc.'s (NASDAQ:SLNG) P/S Is Still On The Mark Following 53% Share Price Bounce
Stabilis Solutions, Inc. (NASDAQ:SLNG) shareholders are no doubt pleased to see that the share price has bounced 53% in the last month, although it is still struggling to make up recently lost ground. The last 30 days bring the annual gain to a very sharp 43%.
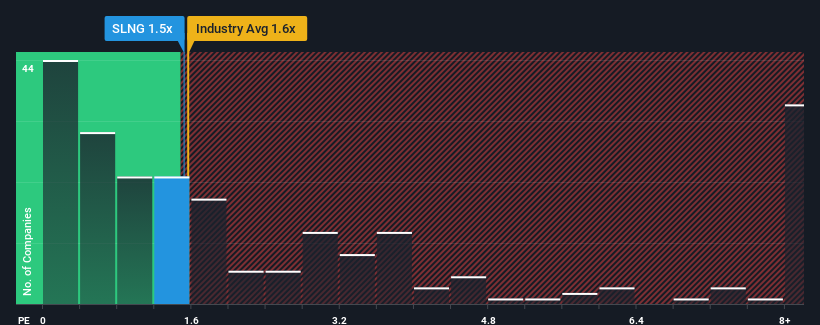
In spite of the firm bounce in price, it's still not a stretch to say that Stabilis Solutions' price-to-sales (or "P/S") ratio of 1.5x right now seems quite "middle-of-the-road" compared to the Oil and Gas industry in the United States, where the median P/S ratio is around 1.6x. However, investors might be overlooking a clear opportunity or potential setback if there is no rational basis for the P/S.
We've discovered 2 warning signs about Stabilis Solutions. View them for free.View our latest analysis for Stabilis Solutions
How Has Stabilis Solutions Performed Recently?
With revenue growth that's inferior to most other companies of late, Stabilis Solutions has been relatively sluggish. Perhaps the market is expecting future revenue performance to lift, which has kept the P/S from declining. However, if this isn't the case, investors might get caught out paying too much for the stock.
Want the full picture on analyst estimates for the company? Then our free report on Stabilis Solutions will help you uncover what's on the horizon.What Are Revenue Growth Metrics Telling Us About The P/S?
Stabilis Solutions' P/S ratio would be typical for a company that's only expected to deliver moderate growth, and importantly, perform in line with the industry.
Retrospectively, the last year delivered virtually the same number to the company's top line as the year before. Still, the latest three year period was better as it's delivered a decent 6.0% overall rise in revenue. Accordingly, shareholders probably wouldn't have been overly satisfied with the unstable medium-term growth rates.
Turning to the outlook, the next year should generate growth of 6.8% as estimated by the lone analyst watching the company. Meanwhile, the rest of the industry is forecast to expand by 8.5%, which is not materially different.
With this in mind, it makes sense that Stabilis Solutions' P/S is closely matching its industry peers. It seems most investors are expecting to see average future growth and are only willing to pay a moderate amount for the stock.
What We Can Learn From Stabilis Solutions' P/S?
Stabilis Solutions' stock has a lot of momentum behind it lately, which has brought its P/S level with the rest of the industry. Using the price-to-sales ratio alone to determine if you should sell your stock isn't sensible, however it can be a practical guide to the company's future prospects.
Our look at Stabilis Solutions' revenue growth estimates show that its P/S is about what we expect, as both metrics follow closely with the industry averages. Right now shareholders are comfortable with the P/S as they are quite confident future revenue won't throw up any surprises. Unless these conditions change, they will continue to support the share price at these levels.
We don't want to rain on the parade too much, but we did also find 2 warning signs for Stabilis Solutions (1 makes us a bit uncomfortable!) that you need to be mindful of.
If strong companies turning a profit tickle your fancy, then you'll want to check out this free list of interesting companies that trade on a low P/E (but have proven they can grow earnings).
New: Manage All Your Stock Portfolios in One Place
We've created the ultimate portfolio companion for stock investors, and it's free.
• Connect an unlimited number of Portfolios and see your total in one currency
• Be alerted to new Warning Signs or Risks via email or mobile
• Track the Fair Value of your stocks
Have feedback on this article? Concerned about the content? Get in touch with us directly. Alternatively, email editorial-team (at) simplywallst.com.
This article by Simply Wall St is general in nature. We provide commentary based on historical data and analyst forecasts only using an unbiased methodology and our articles are not intended to be financial advice. It does not constitute a recommendation to buy or sell any stock, and does not take account of your objectives, or your financial situation. We aim to bring you long-term focused analysis driven by fundamental data. Note that our analysis may not factor in the latest price-sensitive company announcements or qualitative material. Simply Wall St has no position in any stocks mentioned.
About NasdaqCM:SLNG
Stabilis Solutions
An energy transition company, provides turnkey clean energy production, storage, transportation, and fueling solutions primarily using liquefied natural gas (LNG) to various end markets in North America.
Excellent balance sheet with slight risk.
Similar Companies
Market Insights

Advertisement
Community Narratives
MicroVision will explode future revenue by 380.37% with a vision towards success
Fair Value US$60.00|98.4% undervalued
TH
Community Contributor
The Indispensable Artery for a New North American Economy
Fair Value CA$132.87|1.3% undervalued
TI
Community Contributor