
Advertisement
- United States
- /
- Oil and Gas
- /
- NasdaqGS:REGI
Don't Sell Renewable Energy Group, Inc. (NASDAQ:REGI) Before You Read This
Today, we'll introduce the concept of the P/E ratio for those who are learning about investing. To keep it practical, we'll show how Renewable Energy Group, Inc.'s (NASDAQ:REGI) P/E ratio could help you assess the value on offer. What is Renewable Energy Group's P/E ratio? Well, based on the last twelve months it is 14.5. In other words, at today's prices, investors are paying $14.5 for every $1 in prior year profit.
Want to participate in a short research study? Help shape the future of investing tools and you could win a $250 gift card!
View our latest analysis for Renewable Energy Group
How Do You Calculate A P/E Ratio?
The formula for price to earnings is:
Price to Earnings Ratio = Share Price ÷ Earnings per Share (EPS)
Or for Renewable Energy Group:
P/E of 14.5 = $16.24 ÷ $1.12 (Based on the year to March 2019.)
Is A High P/E Ratio Good?
A higher P/E ratio implies that investors pay a higher price for the earning power of the business. That isn't necessarily good or bad, but a high P/E implies relatively high expectations of what a company can achieve in the future.
How Growth Rates Impact P/E Ratios
Probably the most important factor in determining what P/E a company trades on is the earnings growth. If earnings are growing quickly, then the 'E' in the equation will increase faster than it would otherwise. That means even if the current P/E is high, it will reduce over time if the share price stays flat. So while a stock may look expensive based on past earnings, it could be cheap based on future earnings.
Renewable Energy Group saw earnings per share decrease by 73% last year. And over the longer term (5 years) earnings per share have decreased 21% annually. This might lead to muted expectations.
Does Renewable Energy Group Have A Relatively High Or Low P/E For Its Industry?
The P/E ratio indicates whether the market has higher or lower expectations of a company. As you can see below, Renewable Energy Group has a higher P/E than the average company (13.3) in the oil and gas industry.
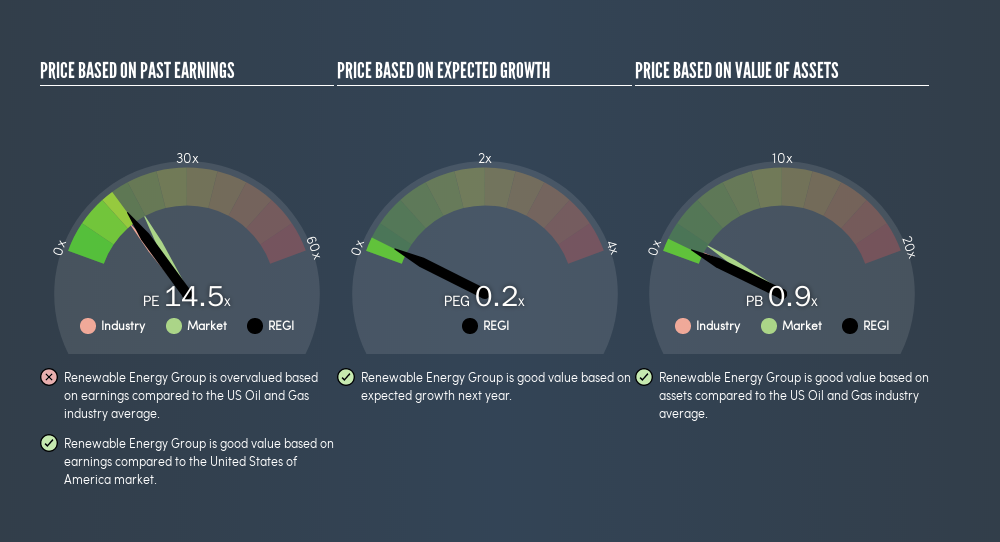
Renewable Energy Group's P/E tells us that market participants think the company will perform better than its industry peers, going forward. The market is optimistic about the future, but that doesn't guarantee future growth. So investors should delve deeper. I like to check if company insiders have been buying or selling.
Don't Forget: The P/E Does Not Account For Debt or Bank Deposits
It's important to note that the P/E ratio considers the market capitalization, not the enterprise value. Thus, the metric does not reflect cash or debt held by the company. Theoretically, a business can improve its earnings (and produce a lower P/E in the future) by investing in growth. That means taking on debt (or spending its cash).
Spending on growth might be good or bad a few years later, but the point is that the P/E ratio does not account for the option (or lack thereof).
Is Debt Impacting Renewable Energy Group's P/E?
Net debt is 32% of Renewable Energy Group's market cap. While that's enough to warrant consideration, it doesn't really concern us.
The Bottom Line On Renewable Energy Group's P/E Ratio
Renewable Energy Group trades on a P/E ratio of 14.5, which is below the US market average of 17.7. With only modest debt, it's likely the lack of EPS growth at least partially explains the pessimism implied by the P/E ratio.
Investors have an opportunity when market expectations about a stock are wrong. If the reality for a company is not as bad as the P/E ratio indicates, then the share price should increase as the market realizes this. So this free visualization of the analyst consensus on future earnings could help you make the right decision about whether to buy, sell, or hold.
You might be able to find a better buy than Renewable Energy Group. If you want a selection of possible winners, check out this free list of interesting companies that trade on a P/E below 20 (but have proven they can grow earnings).
We aim to bring you long-term focused research analysis driven by fundamental data. Note that our analysis may not factor in the latest price-sensitive company announcements or qualitative material.
If you spot an error that warrants correction, please contact the editor at editorial-team@simplywallst.com. This article by Simply Wall St is general in nature. It does not constitute a recommendation to buy or sell any stock, and does not take account of your objectives, or your financial situation. Simply Wall St has no position in the stocks mentioned. Thank you for reading.
About NasdaqGS:REGI
Renewable Energy Group
Renewable Energy Group, Inc. provides lower carbon transportation fuels in the United States and internationally.
Excellent balance sheet with proven track record.
Similar Companies
Market Insights

Advertisement
Community Narratives
Finding The True Value Of A Logistics Powerhouse
Fair Value US$95.21|8.7% undervalued
NV
Community Contributor
Paradigm Biopharmaceuticals Will Lead Osteoarthritis Treatment with Zilosul's FDA Success
Fair Value AU$5.50|93.3% undervalued
AM
Community Contributor
Barrick Mining (ABX:CA): A Gold Hedge against a U.S. Shutdown
Fair Value CA$60.00|18.7% undervalued
GM
Community Contributor