Advertisement
- United States
- /
- Consumer Finance
- /
- NYSE:SYF
Is Synchrony Financial Fairly Priced After Recent Digital Lending Expansion in 2025?

Simply Wall St
Reviewed by Bailey Pemberton
- If you have been eyeing Synchrony Financial and wondering if it is fairly priced, you are in the right place to dig deeper into its true value.
- After a strong 159.2% gain over five years, the stock has continued to grow, delivering 11.2% year-to-date and 14.7% over the last twelve months, even though it dipped 3.9% in the past week.
- Recent headlines highlight Synchrony’s ongoing expansion in digital lending partnerships and new strategic collaborations in the payments sector, which have fueled both optimism and some short-term volatility in the share price.
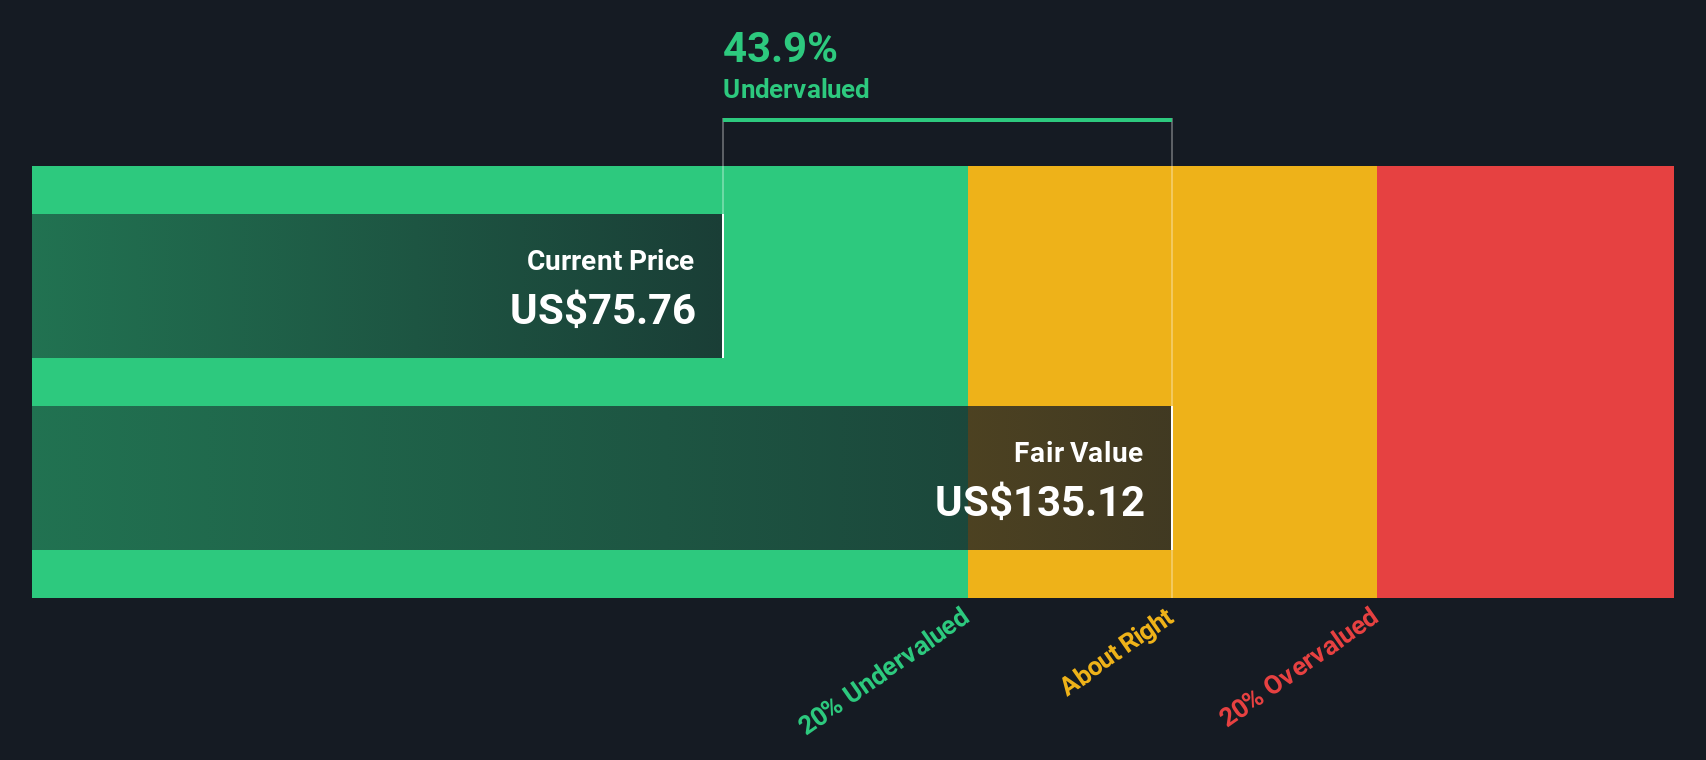
- Currently, Synchrony scores 5 out of 6 on our valuation checks. This suggests the stock may be undervalued by several measures, but there is more to the story. Let’s break down the numbers and reveal an even smarter approach to valuation by the end of this article.
Find out why Synchrony Financial's 14.7% return over the last year is lagging behind its peers.
Approach 1: Synchrony Financial Excess Returns Analysis
The Excess Returns Model offers a unique lens for analyzing value by measuring how much profit Synchrony Financial generates from its shareholders’ equity above its assumed cost of equity. This approach highlights the company’s efficiency at converting investments into meaningful returns for investors, while also examining growth and stability projections based on analyst forecasts.
For Synchrony Financial, the current Book Value stands at $43.99 per share, and analysts estimate a Stable Book Value of $51.00 per share. The company’s Stable EPS is $10.04 per share, calculated using weighted future Return on Equity estimates provided by 12 analysts. With an attractive average Return on Equity of 19.69% and a Cost of Equity at $4.57 per share, Synchrony delivers an annual Excess Return of $5.47 per share. Such figures signal strong efficiency and profitability relative to the capital entrusted by shareholders.
The model aggregates these factors to arrive at an estimated intrinsic value of $146.98 per share. Compared to the market price, this suggests Synchrony Financial could be undervalued by approximately 50.6%. Investors looking for value in the Consumer Finance space may find Synchrony’s current market price particularly attractive under this model.
Result: UNDERVALUED
Our Excess Returns analysis suggests Synchrony Financial is undervalued by 50.6%. Track this in your watchlist or portfolio, or discover 898 more undervalued stocks based on cash flows.
Approach 2: Synchrony Financial Price vs Earnings
The Price-to-Earnings (PE) ratio is a widely recognized metric for valuing profitable companies like Synchrony Financial because it relates the company’s current share price to its per-share earnings. For businesses with robust earnings streams, PE offers a direct way to gauge how much investors are willing to pay for each dollar of profit.
When comparing PE ratios, it’s important to remember that expectations for future growth and the level of risk can drive what’s considered a "normal" or "fair" PE for any company. Firms with faster expected growth and lower risk typically command a higher PE ratio, while slower or riskier businesses trend lower.
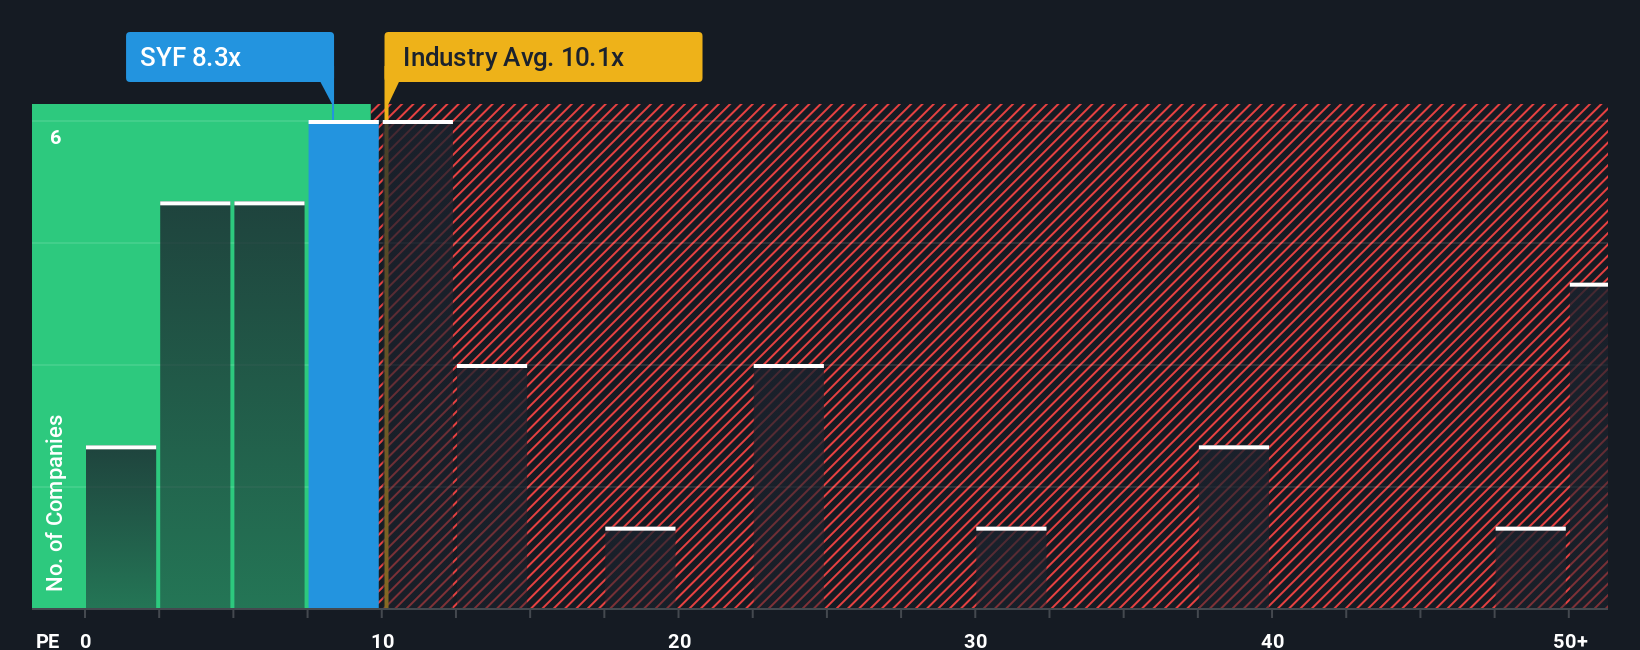
Synchrony Financial’s current PE ratio stands at 7.5x. This is meaningfully below both its Consumer Finance industry average of 9.9x and its peer average of 35.5x, hinting at a potential undervaluation. However, rather than just sticking with industry or peer benchmarks, Simply Wall St’s proprietary "Fair Ratio" blends in multiple factors including earnings growth, profitability, risk profile, industry trends, and market capitalization to provide a more rounded view. For Synchrony, the Fair Ratio is 13.8x, reflecting the earnings multiple an investor should logically expect given these features.
Comparing Synchrony’s current PE of 7.5x to its Fair Ratio of 13.8x suggests that the stock is trading at a significant discount, pointing to material undervaluation on this metric.
Result: UNDERVALUED
PE ratios tell one story, but what if the real opportunity lies elsewhere? Discover 1416 companies where insiders are betting big on explosive growth.
Upgrade Your Decision Making: Choose your Synchrony Financial Narrative
Earlier we mentioned that there is an even better way to understand valuation, so let’s introduce you to Narratives. A Narrative is your personal story behind the numbers, where you choose what you believe about Synchrony Financial’s future revenue, earnings, and margins. These assumptions build your own “fair value” for the company and align it with your unique perspective.
Narratives connect the dots between a company’s outlook, a financial forecast, and a fair value estimate, so you can easily see if the stock’s current price reflects your view of the business. On Simply Wall St’s Community page, Narratives are accessible and interactive. Millions of investors already use them to guide smarter buy or sell decisions by tracking how their fair value compares to live market prices. These Narratives update automatically when new data or breaking news arrives, making sure your insights always reflect the latest information.
For Synchrony Financial, one investor might craft a bullish Narrative driven by optimism about digital partnerships and robust earnings, estimating a high fair value like $100.00 per share. Another may take a more cautious stance due to market risks or competition, setting their fair value closer to $60.00 per share. Narratives empower you to make choices based on your own informed story, not just headline numbers.
Do you think there's more to the story for Synchrony Financial? Head over to our Community to see what others are saying!

This article by Simply Wall St is general in nature. We provide commentary based on historical data and analyst forecasts only using an unbiased methodology and our articles are not intended to be financial advice. It does not constitute a recommendation to buy or sell any stock, and does not take account of your objectives, or your financial situation. We aim to bring you long-term focused analysis driven by fundamental data. Note that our analysis may not factor in the latest price-sensitive company announcements or qualitative material. Simply Wall St has no position in any stocks mentioned.
New: Manage All Your Stock Portfolios in One Place
We've created the ultimate portfolio companion for stock investors, and it's free.
• Connect an unlimited number of Portfolios and see your total in one currency
• Be alerted to new Warning Signs or Risks via email or mobile
• Track the Fair Value of your stocks
Have feedback on this article? Concerned about the content? Get in touch with us directly. Alternatively, email editorial-team@simplywallst.com
About NYSE:SYF
Synchrony Financial
Operates as a consumer financial services company in the United States.
Undervalued with solid track record.
Similar Companies
Market Insights

Advertisement
Community Narratives
MicroVision will explode future revenue by 380.37% with a vision towards success
Fair Value US$60.00|98.5% undervalued
TH
Community Contributor
The Indispensable Artery for a New North American Economy
Fair Value CA$132.87|2.3% undervalued
TI
Community Contributor