Advertisement
- United States
- /
- Capital Markets
- /
- NYSE:SPGI
A Fresh Look at S&P Global (SPGI) Valuation Following Tech Leadership Transition Announcement

Simply Wall St
Reviewed by Kshitija Bhandaru
S&P Global (SPGI) has announced that Swamy Kocherlakota, its Chief Digital Solutions Officer, will be leaving at the end of 2025. Kocherlakota drove significant progress in technology and AI, particularly through the digital integration following the IHS Markit merger.
See our latest analysis for S&P Global.
S&P Global’s latest executive change comes as the company navigates a year of relatively muted movement. Its one-year total shareholder return sits just below flat, underscoring a pause after strong three-year gains of over 54%. While the share price has remained steady lately, recent events like the IHS Markit integration and prominent industry presentations highlight the company’s commitment to evolving its digital and data leadership. This could rekindle momentum as new technology leadership steps in.
If company leadership shifts have you thinking about broader opportunities, now’s a great time to explore fast growing stocks with high insider ownership.
After a year of underwhelming returns and notable executive turnover, the question becomes whether S&P Global shares now present an undervalued opportunity or if the market is already pricing in its next wave of growth.
Price-to-Earnings of 36.3x: Is it justified?
At a closing price of $476.63, S&P Global currently trades on a price-to-earnings ratio of 36.3x, which is notably above both industry and peer averages and indicates a premium valuation.
The price-to-earnings (P/E) ratio reflects what investors are willing to pay for each dollar of company earnings. A higher ratio often implies high expectations for future profit growth or exceptional market leadership. For S&P Global, this suggests that the market may be pricing in impressive future earnings or continued dominance in its field.
SPGI’s P/E not only exceeds the US Capital Markets industry average of 26.2x, but it also surpasses the peer average of 32.6x and the estimated fair P/E of 20.2x. This sizable premium suggests investors are optimistic about the company’s trajectory. However, it raises the question of whether such expectations are sustainable or if there could be a pullback toward the fair value benchmark.
Explore the SWS fair ratio for S&P Global
Result: Price-to-Earnings of 36.3x (OVERVALUED)
However, disappointing recent returns and increased executive turnover could signal challenges ahead and may pause the strong growth narrative investors expect.
Find out about the key risks to this S&P Global narrative.
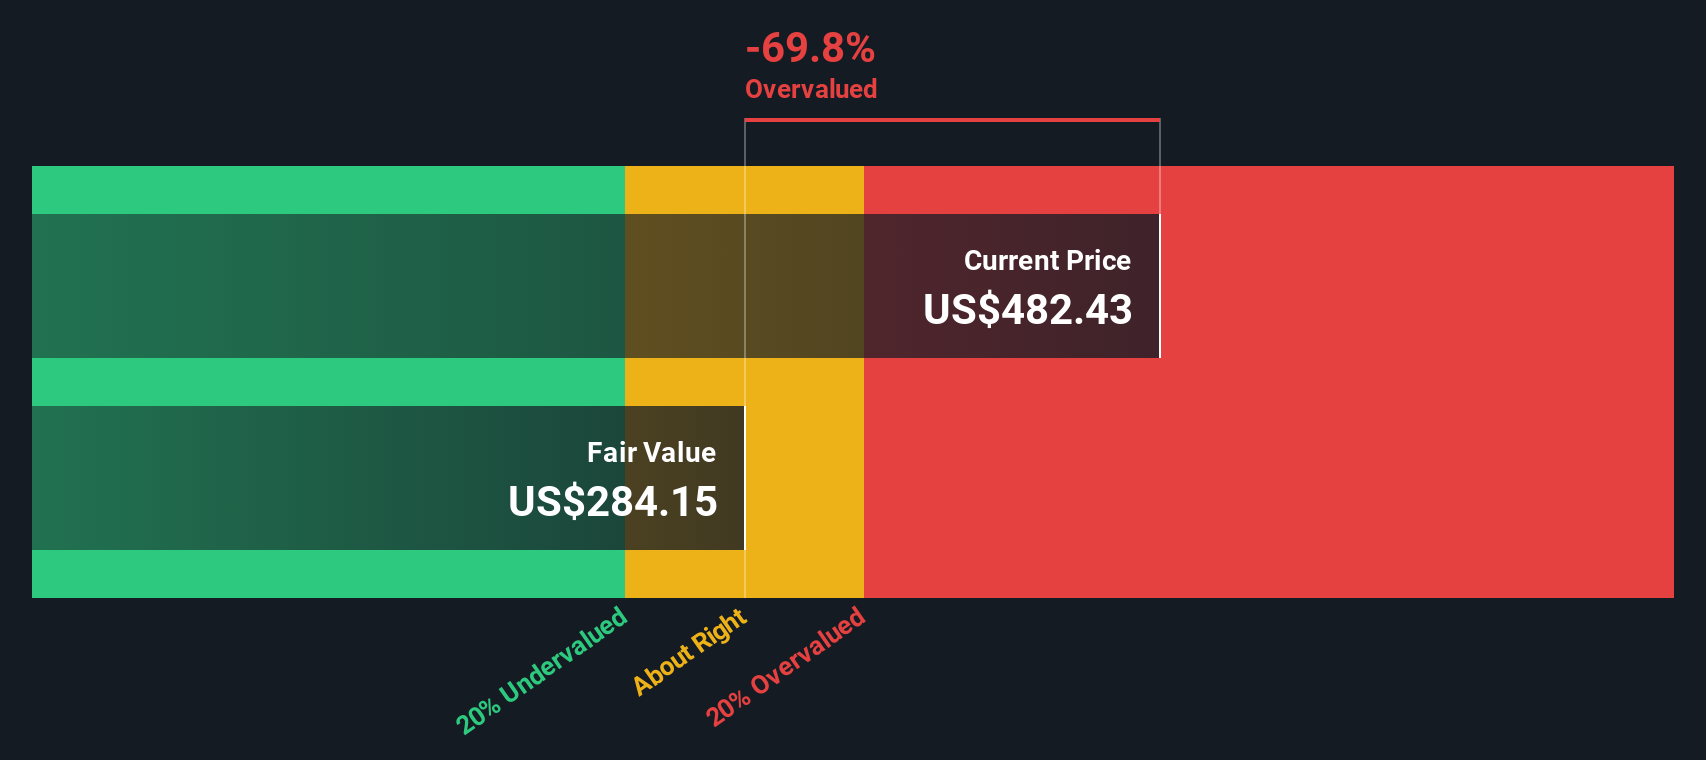
Another View: DCF Model Suggests a Very Different Story
While earnings multiples point to a premium valuation, our DCF model reaches a much less optimistic conclusion. According to this method, S&P Global shares are actually trading above fair value. The latest estimate puts true worth at around $285.14. Does this disconnect reflect an opportunity or hidden risk?
Look into how the SWS DCF model arrives at its fair value.
Simply Wall St performs a discounted cash flow (DCF) on every stock in the world every day (check out S&P Global for example). We show the entire calculation in full. You can track the result in your watchlist or portfolio and be alerted when this changes, or use our stock screener to discover undervalued stocks based on their cash flows. If you save a screener we even alert you when new companies match - so you never miss a potential opportunity.
Build Your Own S&P Global Narrative
If you see things differently or want to run your own analysis, it takes just a few minutes to shape your own S&P Global outlook. Do it your way.
A great starting point for your S&P Global research is our analysis highlighting 3 key rewards and 1 important warning sign that could impact your investment decision.
Looking for more investment ideas?
Act now to expand your investment horizons and spot fresh winners with the Simply Wall Street Screener. Don’t let smart opportunities pass you by.
- Jump on untapped growth potential by reviewing these 914 undervalued stocks based on cash flows, which could be trading below their true worth right now.
- Tap into tech’s next big wave and meet the innovators powering advances in medicine with these 31 healthcare AI stocks.
- Collect reliable income with these 19 dividend stocks with yields > 3%, offering attractive yields and resilient financials for peace of mind.
This article by Simply Wall St is general in nature. We provide commentary based on historical data and analyst forecasts only using an unbiased methodology and our articles are not intended to be financial advice. It does not constitute a recommendation to buy or sell any stock, and does not take account of your objectives, or your financial situation. We aim to bring you long-term focused analysis driven by fundamental data. Note that our analysis may not factor in the latest price-sensitive company announcements or qualitative material. Simply Wall St has no position in any stocks mentioned.
New: Manage All Your Stock Portfolios in One Place
We've created the ultimate portfolio companion for stock investors, and it's free.
• Connect an unlimited number of Portfolios and see your total in one currency
• Be alerted to new Warning Signs or Risks via email or mobile
• Track the Fair Value of your stocks
Have feedback on this article? Concerned about the content? Get in touch with us directly. Alternatively, email editorial-team@simplywallst.com
About NYSE:SPGI
S&P Global
Provides credit ratings, benchmarks, analytics, and workflow solutions in the global capital, commodity, and automotive markets.
Solid track record with adequate balance sheet and pays a dividend.
Similar Companies
Market Insights

Advertisement
Community Narratives
The Next Phase of Energy Storage: How NeoVolta Is Tackling America’s Power Crunch
Fair Value US$7.50|35.2% undervalued
MA
Community Contributor
Why EnSilica is Worth Possibly 13x its Current Price
Fair Value UK£5.00|90.0% undervalued
DO
Community Contributor
M&A Activity, Industry Diversification & A Defense Contract Monopoly Will Push BWXT For Healthy Long-Term Growth
Fair Value US$220.00|15.6% undervalued
CL
Community Contributor
A case for Cassiar Gold Corp (TSXV: GLDC) to reach CAD$8-10 before 2030 (X30-37)
Fair Value CA$10.00|97.1% undervalued
AG
Community Contributor