- United States
- /
- Capital Markets
- /
- NYSE:MN
Is Manning & Napier's (NYSE:MN) Share Price Gain Of 245% Well Earned?


When you buy shares in a company, there is always a risk that the price drops to zero. On the other hand, if you find a high quality business to buy (at the right price) you can more than double your money! For example, the Manning & Napier, Inc. (NYSE:MN) share price had more than doubled in just one year - up 245%. And in the last month, the share price has gained 23%. This could be related to the recent financial results that were recently released - you could check the most recent data by reading our company report. Also impressive, the stock is up 74% over three years, making long term shareholders happy, too.
Check out our latest analysis for Manning & Napier
There is no denying that markets are sometimes efficient, but prices do not always reflect underlying business performance. One way to examine how market sentiment has changed over time is to look at the interaction between a company's share price and its earnings per share (EPS).
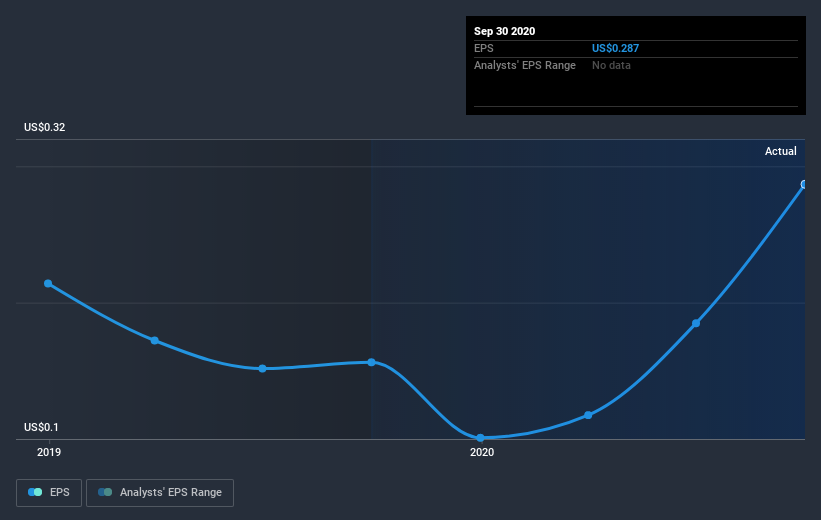
Manning & Napier was able to grow EPS by 84% in the last twelve months. The share price gain of 245% certainly outpaced the EPS growth. This indicates that the market is now more optimistic about the stock.
The graphic below depicts how EPS has changed over time (unveil the exact values by clicking on the image).
It's probably worth noting we've seen significant insider buying in the last quarter, which we consider a positive. On the other hand, we think the revenue and earnings trends are much more meaningful measures of the business. Dive deeper into the earnings by checking this interactive graph of Manning & Napier's earnings, revenue and cash flow.
What about the Total Shareholder Return (TSR)?
Investors should note that there's a difference between Manning & Napier's total shareholder return (TSR) and its share price change, which we've covered above. Arguably the TSR is a more complete return calculation because it accounts for the value of dividends (as if they were reinvested), along with the hypothetical value of any discounted capital that have been offered to shareholders. Its history of dividend payouts mean that Manning & Napier's TSR of 254% over the last year is better than the share price return.
A Different Perspective
It's good to see that Manning & Napier has rewarded shareholders with a total shareholder return of 254% in the last twelve months. There's no doubt those recent returns are much better than the TSR loss of 0.9% per year over five years. The long term loss makes us cautious, but the short term TSR gain certainly hints at a brighter future. I find it very interesting to look at share price over the long term as a proxy for business performance. But to truly gain insight, we need to consider other information, too. Take risks, for example - Manning & Napier has 3 warning signs (and 1 which can't be ignored) we think you should know about.
Manning & Napier is not the only stock insiders are buying. So take a peek at this free list of growing companies with insider buying.
Please note, the market returns quoted in this article reflect the market weighted average returns of stocks that currently trade on US exchanges.
If you decide to trade Manning & Napier, use the lowest-cost* platform that is rated #1 Overall by Barron’s, Interactive Brokers. Trade stocks, options, futures, forex, bonds and funds on 135 markets, all from a single integrated account. Promoted
New: Manage All Your Stock Portfolios in One Place
We've created the ultimate portfolio companion for stock investors, and it's free.
• Connect an unlimited number of Portfolios and see your total in one currency
• Be alerted to new Warning Signs or Risks via email or mobile
• Track the Fair Value of your stocks
This article by Simply Wall St is general in nature. It does not constitute a recommendation to buy or sell any stock, and does not take account of your objectives, or your financial situation. We aim to bring you long-term focused analysis driven by fundamental data. Note that our analysis may not factor in the latest price-sensitive company announcements or qualitative material. Simply Wall St has no position in any stocks mentioned.
*Interactive Brokers Rated Lowest Cost Broker by StockBrokers.com Annual Online Review 2020
Have feedback on this article? Concerned about the content? Get in touch with us directly. Alternatively, email editorial-team@simplywallst.com.
About NYSE:MN
Manning & Napier
Manning & Napier, Inc. is publicly owned investment manager.
Flawless balance sheet and good value.
Similar Companies
Market Insights

Community Narratives

