Advertisement
- United States
- /
- Capital Markets
- /
- NYSE:JEF
Jefferies Financial Group (JEF): Assessing Valuation After Recent Performance Shifts

Simply Wall St
Reviewed by Simply Wall St
Jefferies Financial Group (JEF) shares have seen mixed performance lately, with the stock declining about 1% over the past day but gaining 2% this week. Investors are watching recent moves closely, especially given changing trends within financial services.
See our latest analysis for Jefferies Financial Group.
Despite recent volatility, Jefferies Financial Group’s 1-year total shareholder return is down 23%, reflecting shifts in market sentiment and some industry-specific pressures. However, with a five-year total return of nearly 189%, the company’s long-term performance highlights its resilient growth potential even as short-term momentum cools.
If you're looking beyond the usual picks, now is an ideal moment to discover fast growing stocks with high insider ownership.
But after significant multi-year gains followed by this year’s pullback, the big question is whether Jefferies Financial Group is trading at a bargain today or if investors have already factored tomorrow’s growth into the current price.
Price-to-Earnings of 17.8x: Is it justified?
With Jefferies Financial Group trading at a price-to-earnings (P/E) ratio of 17.8x, the stock appears attractively valued relative to peers and industry benchmarks. The last close price of $55.49 reflects a P/E below the US market average and notably undercuts the typical industry levels.
The price-to-earnings multiple measures how much investors are willing to pay today for a dollar of company earnings. For financial services firms, this ratio acts as a key barometer of investor confidence in sustainable profit generation and growth potential.
Jefferies’ P/E of 17.8x is not only lower than the US Capital Markets industry average of 24x, but also below the peer set average of 20.6x. While the stock trades just marginally above its estimated fair value multiple of 17.6x, this suggests the market sees Jefferies as a solid, if not deeply discounted, value proposition within the sector. If market optimism grows or earnings deliver more upside, there is room for this multiple to converge with, or even exceed, fair value benchmarks.
Explore the SWS fair ratio for Jefferies Financial Group
Result: Price-to-Earnings of 17.8x (UNDERVALUED)
However, ongoing volatility in financial markets and shifts in industry regulations still present risks that could quickly alter Jefferies’ current valuation outlook.
Find out about the key risks to this Jefferies Financial Group narrative.
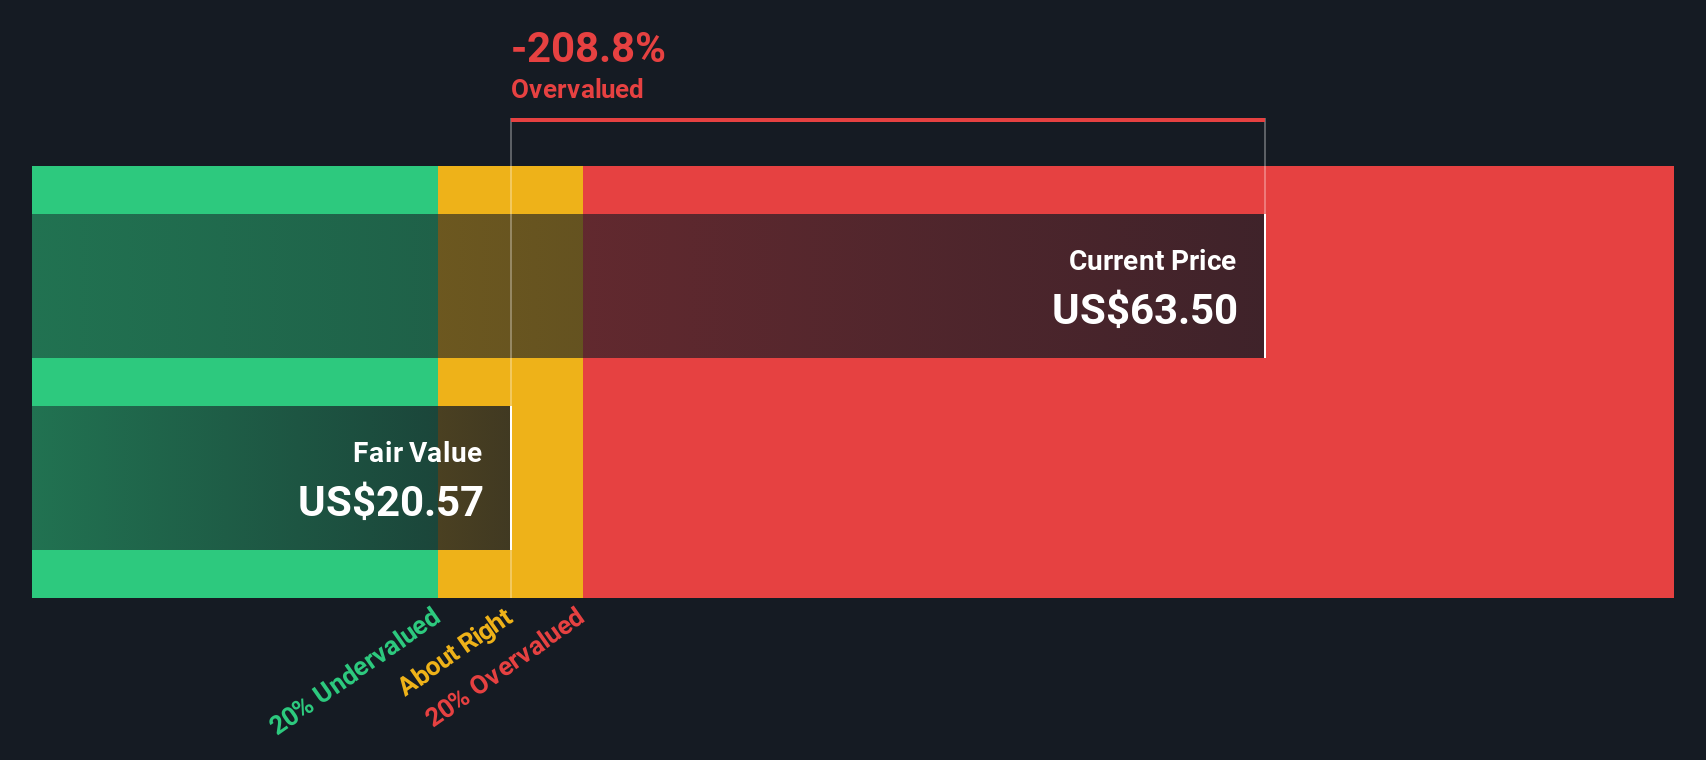
Another View: Discounted Cash Flow Raises Questions
While price-to-earnings comparisons suggest Jefferies Financial Group is a bargain, our SWS DCF model presents a more cautious picture. According to this approach, the company’s current share price is significantly higher than its estimated fair value, which may indicate possible overvaluation if forecasts prove accurate. Does this alternate view point to deeper risks investors should consider?
Look into how the SWS DCF model arrives at its fair value.
Simply Wall St performs a discounted cash flow (DCF) on every stock in the world every day (check out Jefferies Financial Group for example). We show the entire calculation in full. You can track the result in your watchlist or portfolio and be alerted when this changes, or use our stock screener to discover 879 undervalued stocks based on their cash flows. If you save a screener we even alert you when new companies match - so you never miss a potential opportunity.
Build Your Own Jefferies Financial Group Narrative
If our perspective does not align with your own, or if you want to explore the numbers further, you can create your own analysis in just a few minutes, too. Do it your way
A great starting point for your Jefferies Financial Group research is our analysis highlighting 3 key rewards and 1 important warning sign that could impact your investment decision.
Looking for more investment ideas?
You do not have to settle for what's familiar. Take action now to access a world of strategies and industries. There are countless standout opportunities waiting if you know where to look.
- Accelerate your income potential by targeting reliable payers through these 16 dividend stocks with yields > 3%, and put strong yields to work in your portfolio today.
- Seize a competitive edge by scouting fresh prospects among these 25 AI penny stocks, where artificial intelligence is rewriting the rules of the market.
- Start uncovering tomorrow’s market winners with these 3593 penny stocks with strong financials known for remarkable growth and bold innovation at low entry prices.
This article by Simply Wall St is general in nature. We provide commentary based on historical data and analyst forecasts only using an unbiased methodology and our articles are not intended to be financial advice. It does not constitute a recommendation to buy or sell any stock, and does not take account of your objectives, or your financial situation. We aim to bring you long-term focused analysis driven by fundamental data. Note that our analysis may not factor in the latest price-sensitive company announcements or qualitative material. Simply Wall St has no position in any stocks mentioned.
New: Manage All Your Stock Portfolios in One Place
We've created the ultimate portfolio companion for stock investors, and it's free.
• Connect an unlimited number of Portfolios and see your total in one currency
• Be alerted to new Warning Signs or Risks via email or mobile
• Track the Fair Value of your stocks
Have feedback on this article? Concerned about the content? Get in touch with us directly. Alternatively, email editorial-team@simplywallst.com
About NYSE:JEF
Jefferies Financial Group
Operates as an investment banking and capital markets firm in the Americas, Europe, the Middle East, and the Asia-Pacific.
Proven track record average dividend payer.
Similar Companies
Market Insights

Advertisement
Community Narratives
MINISO's fair value is projected at 26.69 with an anticipated PE ratio shift of 20x
Fair Value US$24.03|11.0% undervalued
BE
Community Contributor
Procter & Gamble: A Dividend Giant Facing Slowing Growth
Fair Value US$119.81|23.3% overvalued
AN
Community Contributor
Eli Lilly's Future Growth Driven by Tirzepatide and Favorable Market Conditions
Fair Value US$1.19k|13.8% undervalued
EA
Community Contributor