Advertisement
- United States
- /
- Diversified Financial
- /
- NYSE:EVTC
Should Investors Revisit EVERTEC After Mercado Libre Payment Partnership?

Simply Wall St
Reviewed by Bailey Pemberton
Thinking about what to do with EVERTEC stock? You are not alone. With the price closing at $32.56 and recent returns showing a bit of a slide, many investors are pausing to figure out their next move. Over the past week, EVERTEC dropped 5.4%, and over the last month, it slipped 5.5%. Year to date, the stock is down 5.6%, and even the one-year return sits at -2.4%. Going further back, the five-year return points to a loss of 7.4%. Yet, not all is gloom. When you take a step back and look at broader shifts in the payment processing sector and recent competitive moves in the market, there may be new dynamics shaping sentiment and risk perception here.
Despite those headline numbers, valuation is where things start to get interesting. Based on six key criteria for undervaluation, EVERTEC checks the box on three. That gives it a valuation score of 3, signaling there is real potential for value if you know where to look. Next, we will dig into the different valuation approaches analysts use to gauge whether a stock is truly undervalued. At the end, we will talk about a smarter, more holistic way to see EVERTEC’s real worth.
Why EVERTEC is lagging behind its peers
Approach 1: EVERTEC Excess Returns Analysis
The Excess Returns valuation model evaluates a company by looking at how much profit it generates above the cost of its equity capital. In simple terms, this approach measures how efficiently EVERTEC is using shareholder money to create value. If a company’s return on invested capital is greater than its cost of equity, it is creating “excess returns” and should, in theory, trade at a premium.
For EVERTEC, the figures tell an interesting story:
- Book Value: $9.57 per share
- Stable EPS: $3.39 per share. This comes from the median Return on Equity over the past five years.
- Cost of Equity: $1.16 per share
- Excess Return: $2.23 per share
- Average Return on Equity: 24.51%
- Stable Book Value (looking forward): $13.81 per share, based on weighted estimates from two analysts
When these inputs are run through the model, EVERTEC’s intrinsic value comes out significantly above its current share price, with an implied 41.8% undervaluation. In other words, the numbers suggest that EVERTEC is putting its equity base to work better than both its own cost of capital and many peers.
Result: UNDERVALUED
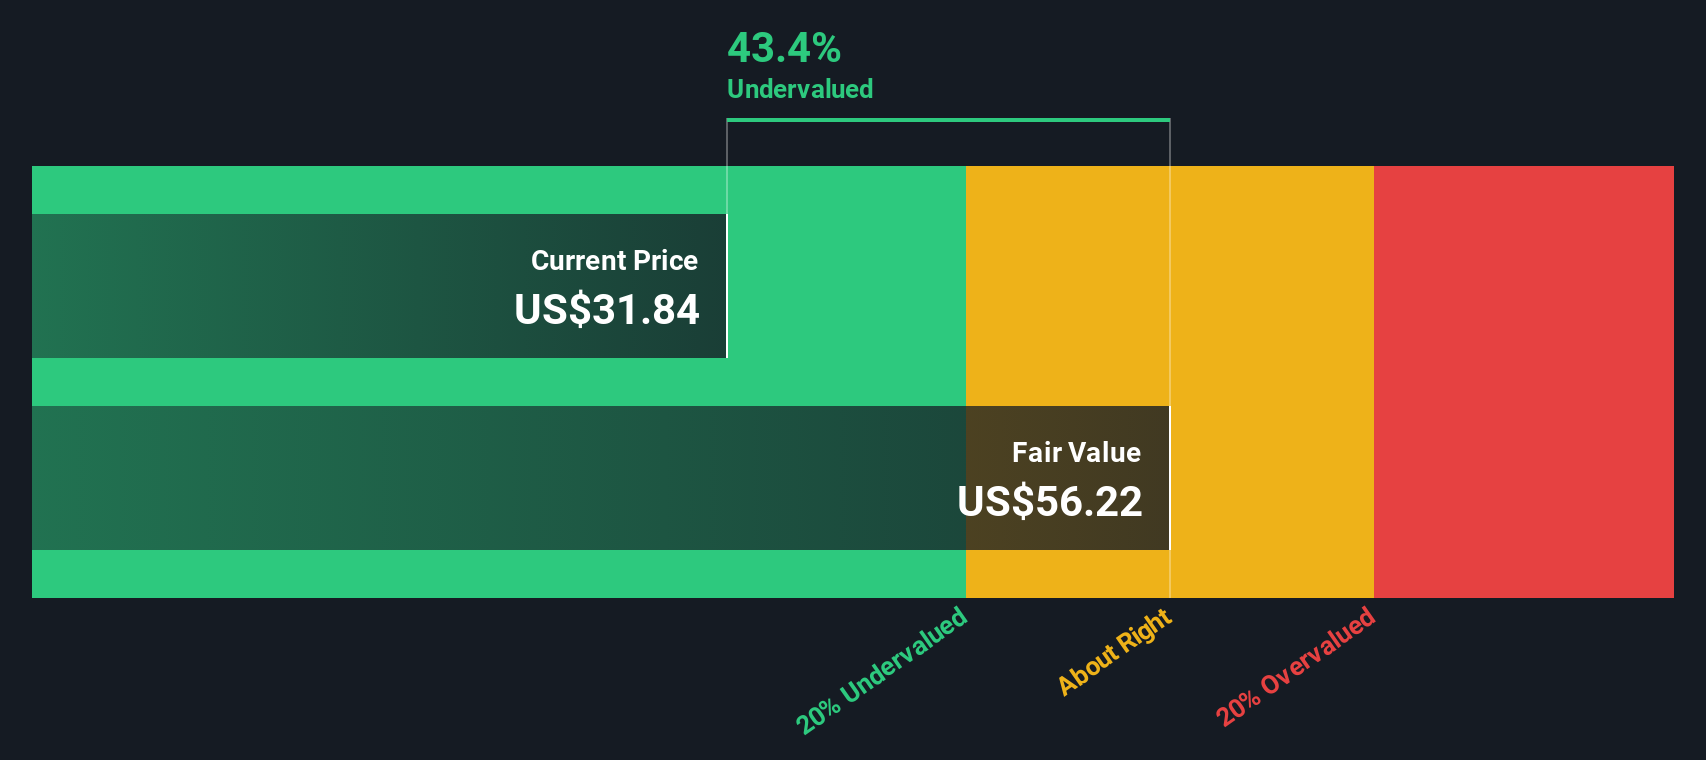
Our Excess Returns analysis suggests EVERTEC is undervalued by 41.8%. Track this in your watchlist or portfolio, or discover more undervalued stocks.
Approach 2: EVERTEC Price vs Earnings
When valuing profitable companies like EVERTEC, the Price-to-Earnings (PE) ratio is often a preferred metric because it reflects what investors are willing to pay today for a dollar of the company’s earnings. It is a straightforward gauge of market sentiment and perceived earnings power. Generally, companies with higher growth expectations and lower risk profiles tend to command higher PE ratios. Less promising or riskier firms typically trade at lower multiples. As such, a “normal” or “fair” PE for a company is shaped by both its growth outlook and its unique risk factors.
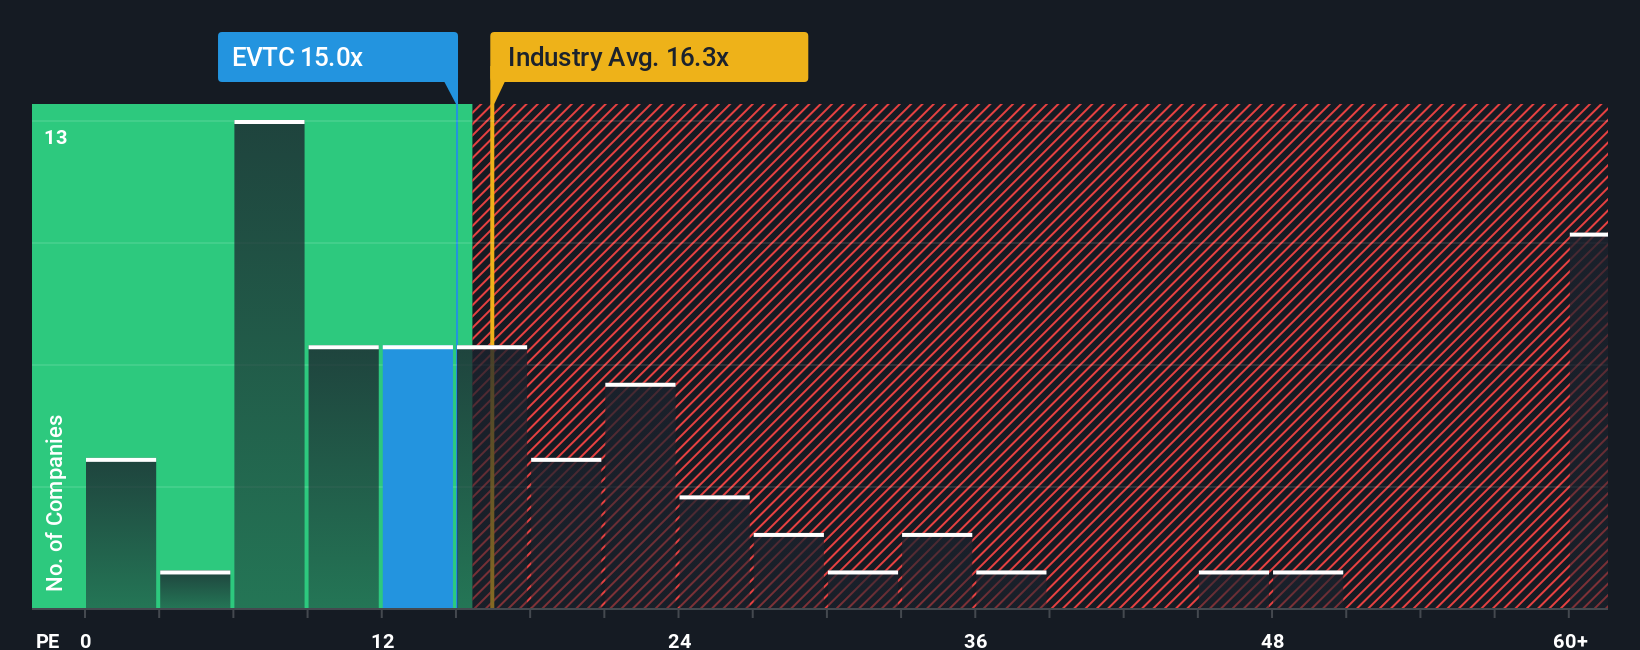
Currently, EVERTEC trades on a PE ratio of 15.1x. To put this in context, its ratio sits below the industry average for Diversified Financials of 16.47x but is notably above the average of its selected peers at 10.54x. These benchmarks suggest that EVERTEC is priced more optimistically than nearby competitors but more conservatively than the broader industry group. However, looking only at these averages can be misleading, as each business has its own growth drivers and risk profile.
This is where Simply Wall St’s proprietary Fair Ratio comes in. For EVERTEC, the Fair Ratio is calculated at 14.09x, taking into account not just industry trends and market cap, but also the company’s expected earnings growth, risk, and profit margins. Unlike a simple peer or industry comparison, the Fair Ratio delivers a more tailored view of what a reasonable PE should be for this specific company.
Comparing EVERTEC’s actual PE of 15.1x to its Fair Ratio of 14.09x, the difference is just about 1x, which is close enough to indicate the stock is trading at roughly a fair valuation based on earnings.
Result: ABOUT RIGHT
PE ratios tell one story, but what if the real opportunity lies elsewhere? Discover companies where insiders are betting big on explosive growth.
Upgrade Your Decision Making: Choose your EVERTEC Narrative
Earlier we mentioned that there is an even better way to understand valuation, so let us introduce you to Narratives. This is a modern and more insightful approach for investors looking to make sense of complex companies like EVERTEC.
A Narrative is essentially your personal story or perspective about a company, connecting your own view on its prospects to the numbers, such as fair value, and estimates of future revenue, earnings, and margins.
Rather than just crunching numbers in isolation, Narratives link the company's story, including its business strategy, risks, and growth opportunities, directly to a financial forecast and ultimately a fair value. This gives context and confidence to every investment decision.
On Simply Wall St’s Community page, Narratives are available as an easy, accessible tool, used by millions of investors who want to clarify how new information, like earnings or news, shifts the story behind the stock and its estimated value.
Narratives help you decide when to buy or sell by letting you compare your own or the community’s Fair Value to the current price. Since they update automatically when new data emerges, you always have a dynamic, up-to-date guide.
For EVERTEC, one investor might craft a bullish Narrative around strong digital payments adoption and new market opportunities supporting a fair value closer to $44, while another could point to customer concentration risk and assign a more cautious value around $34.
Do you think there's more to the story for EVERTEC? Create your own Narrative to let the Community know!
This article by Simply Wall St is general in nature. We provide commentary based on historical data and analyst forecasts only using an unbiased methodology and our articles are not intended to be financial advice. It does not constitute a recommendation to buy or sell any stock, and does not take account of your objectives, or your financial situation. We aim to bring you long-term focused analysis driven by fundamental data. Note that our analysis may not factor in the latest price-sensitive company announcements or qualitative material. Simply Wall St has no position in any stocks mentioned.
Valuation is complex, but we're here to simplify it.
Discover if EVERTEC might be undervalued or overvalued with our detailed analysis, featuring fair value estimates, potential risks, dividends, insider trades, and its financial condition.
Access Free AnalysisHave feedback on this article? Concerned about the content? Get in touch with us directly. Alternatively, email editorial-team@simplywallst.com
About NYSE:EVTC
EVERTEC
Provides transaction processing and financial technology services in Latin America, Puerto Rico, and the Caribbean.
Proven track record with adequate balance sheet.
Similar Companies
Market Insights

Advertisement
Community Narratives
The Next Phase of Energy Storage: How NeoVolta Is Tackling America’s Power Crunch
Fair Value US$7.50|35.1% undervalued
MA
Community Contributor
Why EnSilica is Worth Possibly 13x its Current Price
Fair Value UK£5.00|89.8% undervalued
DO
Community Contributor
M&A Activity, Industry Diversification & A Defense Contract Monopoly Will Push BWXT For Healthy Long-Term Growth
Fair Value US$220.00|15.2% undervalued
CL
Community Contributor
A case for Cassiar Gold Corp (TSXV: GLDC) to reach CAD$8-10 before 2030 (X30-37)
Fair Value CA$10.00|96.0% undervalued
AG
Community Contributor