Dynex Capital (DX) has had an interesting month, with shares edging up about 2%. The company’s steady returns and recent performance prompt investors to consider how current market conditions might affect its long-term prospects.
Dynex Capital's share price has hovered near $12.66 this year. The real story is in its longer-term momentum, with a 1-year total shareholder return approaching 20% and multi-year gains that point to steady wealth creation for patient investors.
With shares trading just shy of analyst targets and impressive long-term gains in the rearview, investors face a key question: Is Dynex Capital undervalued today, or is the market already factoring in all the potential upside?
Advertisement
Price-to-Earnings of 28.9x: Is it justified?
Dynex Capital is trading at a price-to-earnings (P/E) ratio of 28.9x, which is significantly higher than both its peer group and the broader US Mortgage REITs industry averages. This premium raises questions about whether investors are paying up for growth or if the stock price overshoots its underlying fundamentals.
The price-to-earnings ratio is a fundamental metric that compares a company's current share price to its per-share earnings. For a real estate investment trust (REIT) like Dynex Capital, the P/E ratio is especially relevant since it reflects what investors are willing to pay for each dollar of earnings.
Currently, Dynex Capital carries a P/E ratio of 28.9x. Its peers average 12.3x, and the broader industry stands at 13.6x. This positioning suggests the market is pricing in robust future growth, perhaps in anticipation of the company's recent surge in earnings growth or improved profit margins. Compared to the estimated fair price-to-earnings ratio of 52.5x, there is still perceived room for further upside should those optimistic projections play out.
However, any slowdown in revenue growth or unexpected shifts in profit margins could quickly challenge the optimism that investors currently associate with Dynex Capital’s shares.
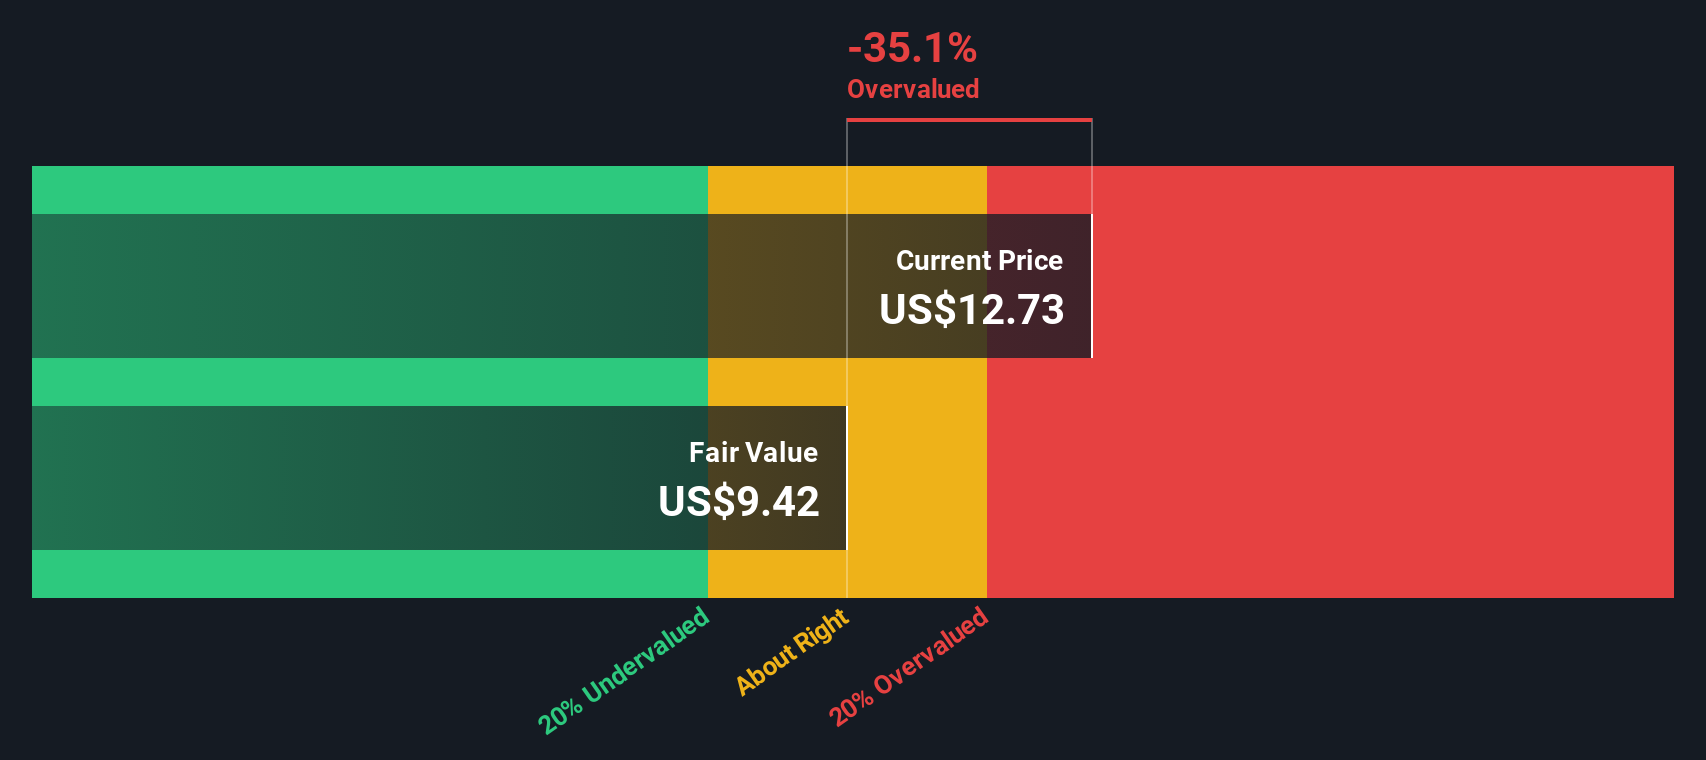
Looking at Dynex Capital from the perspective of our SWS DCF model provides a different angle. The DCF suggests shares are trading above fair value, with the current price at $12.66 compared to an estimated fair value of $9.42. This view indicates potential overvaluation at this time.
Simply Wall St performs a discounted cash flow (DCF) on every stock in the world every day (check out Dynex Capital for example). We show the entire calculation in full. You can track the result in your watchlist or portfolio and be alerted when this changes, or use our stock screener to discover undervalued stocks based on their cash flows. If you save a screener we even alert you when new companies match - so you never miss a potential opportunity.
Build Your Own Dynex Capital Narrative
If you want to test these conclusions for yourself, dive into the numbers and build your own perspective in just a few minutes: Do it your way.
Set your portfolio up for success by acting now. Smart investors are already tracking tomorrow's winners. Get ahead of the curve with these handpicked opportunities:
Seize the potential of next-generation breakthroughs by tapping into these 26 quantum computing stocks shaping what’s possible in hardware, security, and AI.
This article by Simply Wall St is general in nature. We provide commentary based on historical data
and analyst forecasts only using an unbiased methodology and our articles are not intended to be financial advice. It does not constitute a recommendation to buy or sell any stock, and does not take account of your objectives, or your
financial situation. We aim to bring you long-term focused analysis driven by fundamental data.
Note that our analysis may not factor in the latest price-sensitive company announcements or qualitative material.
Simply Wall St has no position in any stocks mentioned.
New: Manage All Your Stock Portfolios in One Place
We've created the ultimate portfolio companion for stock investors, and it's free.
• Connect an unlimited number of Portfolios and see your total in one currency • Be alerted to new Warning Signs or Risks via email or mobile • Track the Fair Value of your stocks