Advertisement
- United States
- /
- Diversified Financial
- /
- NYSE:BRK.B
Berkshire Hathaway (BRK.B): Evaluating Valuation After a Period of Slower Share Price Momentum

Simply Wall St
Reviewed by Simply Wall St
Berkshire Hathaway (BRK.B) has been a topic of conversation recently, with its share price seeing some modest movement over the past week and past month. Investors often look for signals in these shifts to better gauge the company's valuation relative to its peers.
See our latest analysis for Berkshire Hathaway.
Over the past year, Berkshire Hathaway's share price has climbed at a steady pace, up 8.2% year-to-date, while recent momentum has cooled a little in the last month. The bigger story is in its solid long-term performance, with a 6.45% total shareholder return in the past year and an impressive 138.9% gain over five years. This is a sign that long-term investors have been consistently rewarded despite short-term shifts.
If Berkshire’s steady track record has you watching for what’s next, it could be a great moment to expand your search and discover fast growing stocks with high insider ownership
This raises a key question for investors. As Berkshire Hathaway’s future growth and consistently strong returns meet a period of softer momentum, is there still a buying opportunity here or has the market already priced in what is to come?
Price-to-Earnings of 16.8x: Is it justified?
At its last close of $488.07, Berkshire Hathaway currently trades on a price-to-earnings (P/E) ratio of 16.8x. This is noticeably below the peer group average of 28.1x, indicating the market may not be fully valuing its earnings compared to similar companies.
The price-to-earnings ratio reflects how much shareholders are willing to pay for a dollar of current earnings. For Berkshire Hathaway, a diversified conglomerate with steady income streams, the P/E can reveal investor expectations for its future profitability against peers in the financial sector.
Being valued well below the peer average can mean the market is underappreciating Berkshire’s quality of earnings and stable long-term growth record. However, it is worth noting that while Berkshire’s P/E looks attractive compared to its peers, it is considered slightly expensive versus the US Diversified Financial industry average (16.6x). Compared to its fair P/E ratio estimate of 19.8x, there is still room for shares to re-rate upwards if confidence in long-term earnings improves.
Explore the SWS fair ratio for Berkshire Hathaway
Result: Price-to-Earnings of 16.8x (UNDERVALUED)
However, risks remain, as slowing net income growth and recent share price softness could spark fresh uncertainty for even long-term Berkshire shareholders.
Find out about the key risks to this Berkshire Hathaway narrative.
Another View: What Does Our DCF Model Indicate?
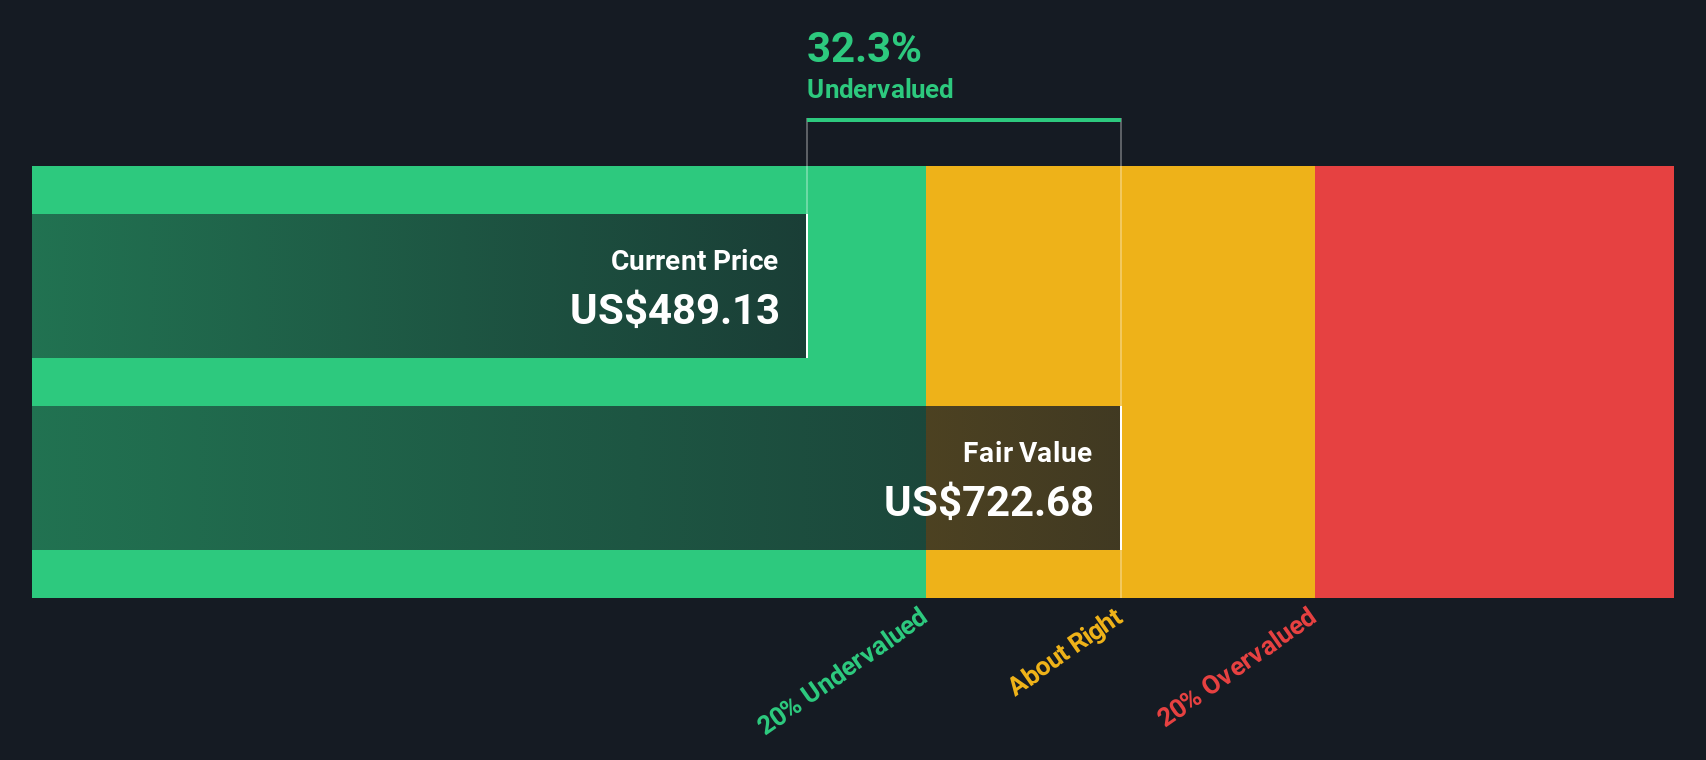
Taking a different approach, the SWS DCF model values Berkshire Hathaway shares at $717.87, which is well above the current market price of $488.07. This suggests the company could be significantly undervalued when we focus on expected cash flows rather than earnings multiples. But can future cash flows defy recent profit forecasts?
Look into how the SWS DCF model arrives at its fair value.
Simply Wall St performs a discounted cash flow (DCF) on every stock in the world every day (check out Berkshire Hathaway for example). We show the entire calculation in full. You can track the result in your watchlist or portfolio and be alerted when this changes, or use our stock screener to discover undervalued stocks based on their cash flows. If you save a screener we even alert you when new companies match - so you never miss a potential opportunity.
Build Your Own Berkshire Hathaway Narrative
If you would rather draw your own conclusions or test an alternative viewpoint, it is quick and easy to put together your own analysis in just a few minutes, so why not Do it your way
A great starting point for your Berkshire Hathaway research is our analysis highlighting 1 key reward and 1 important warning sign that could impact your investment decision.
Looking for more investment ideas?
Don't miss out on opportunities beyond Berkshire Hathaway. Use the Simply Wall Street Screener to pinpoint stocks with outstanding growth, income, or innovation potential before others catch on.
- Tap into market momentum with these 875 undervalued stocks based on cash flows, which are primed for long-term gains based on solid fundamentals and real cash flow strength.
- Secure a stream of income by targeting these 19 dividend stocks with yields > 3%, offering above-average yields and resilient payout histories.
- Ride the future of healthcare by investing in these 34 healthcare AI stocks, which are revolutionizing patient care and life sciences with advanced artificial intelligence.
This article by Simply Wall St is general in nature. We provide commentary based on historical data and analyst forecasts only using an unbiased methodology and our articles are not intended to be financial advice. It does not constitute a recommendation to buy or sell any stock, and does not take account of your objectives, or your financial situation. We aim to bring you long-term focused analysis driven by fundamental data. Note that our analysis may not factor in the latest price-sensitive company announcements or qualitative material. Simply Wall St has no position in any stocks mentioned.
Valuation is complex, but we're here to simplify it.
Discover if Berkshire Hathaway might be undervalued or overvalued with our detailed analysis, featuring fair value estimates, potential risks, dividends, insider trades, and its financial condition.
Access Free AnalysisHave feedback on this article? Concerned about the content? Get in touch with us directly. Alternatively, email editorial-team@simplywallst.com
About NYSE:BRK.B
Berkshire Hathaway
Through its subsidiaries, engages in the insurance, freight rail transportation, and utility businesses.
Flawless balance sheet and good value.
Similar Companies
Market Insights

Advertisement
Community Narratives
Finding The True Value Of A Logistics Powerhouse
Fair Value US$95.21|6.3% undervalued
NV
Community Contributor
Paradigm Biopharmaceuticals Will Lead Osteoarthritis Treatment with Zilosul's FDA Success
Fair Value AU$5.50|91.9% undervalued
AM
Community Contributor
Barrick Mining (ABX:CA): A Gold Hedge against a U.S. Shutdown
Fair Value CA$60.00|25.8% undervalued
GM
Community Contributor