Advertisement
- United States
- /
- Diversified Financial
- /
- NYSE:BRK.B
Assessing Berkshire Hathaway (BRK.B) Valuation After Recent Share Price Dip

Simply Wall St
Reviewed by Kshitija Bhandaru
Berkshire Hathaway (BRK.B) shares have edged slightly lower over the past week, catching the attention of investors who follow the company’s steady long-term track record. Despite the dip, recent performance remains positive both year-to-date and over the past year.
See our latest analysis for Berkshire Hathaway.
After a steady run earlier this year, Berkshire Hathaway’s share price has cooled slightly, though the longer-term picture still looks solid. The stock currently trades at $489.13. Even with recent modest declines, momentum over the past year remains positive. A 6.3% total shareholder return and a 131% total shareholder return over five years reflect strong compounding for patient investors.
If you’re keen to see what else could deliver outsized gains, now’s a good time to branch out and discover fast growing stocks with high insider ownership
With shares pulling back despite consistent earnings and solid long-term growth, investors are now left wondering whether Berkshire Hathaway is undervalued or if the market is already factoring in all of its future prospects.
Price-to-Earnings of 16.8x: Is it justified?
Berkshire Hathaway’s current share price of $489.13 reflects a price-to-earnings (P/E) ratio of 16.8x, setting it slightly above the industry average. This multiple signals that investors are paying a premium for each dollar of the company’s earnings compared to the broader diversified financial sector.
The P/E ratio compares a company’s stock price to its earnings per share, offering a benchmark for valuing companies with steady profits. For a holding company like Berkshire Hathaway, the multiple can also reflect market confidence in management and long-term performance.
At 16.8x, Berkshire’s P/E sits higher than the industry average of 15.7x but remains well below the peer average of 25.9x. While the fair P/E, estimated at 19.8x, suggests there could be room for upward re-rating, Berkshire currently trades at a discount to this level. This may indicate some potential upside if the market aligns with the fair value framework.
Explore the SWS fair ratio for Berkshire Hathaway
Result: Price-to-Earnings of 16.8x (ABOUT RIGHT)
However, slower net income growth and a modest revenue increase could challenge the positive outlook, particularly if market or sector conditions become unfavorable.
Find out about the key risks to this Berkshire Hathaway narrative.
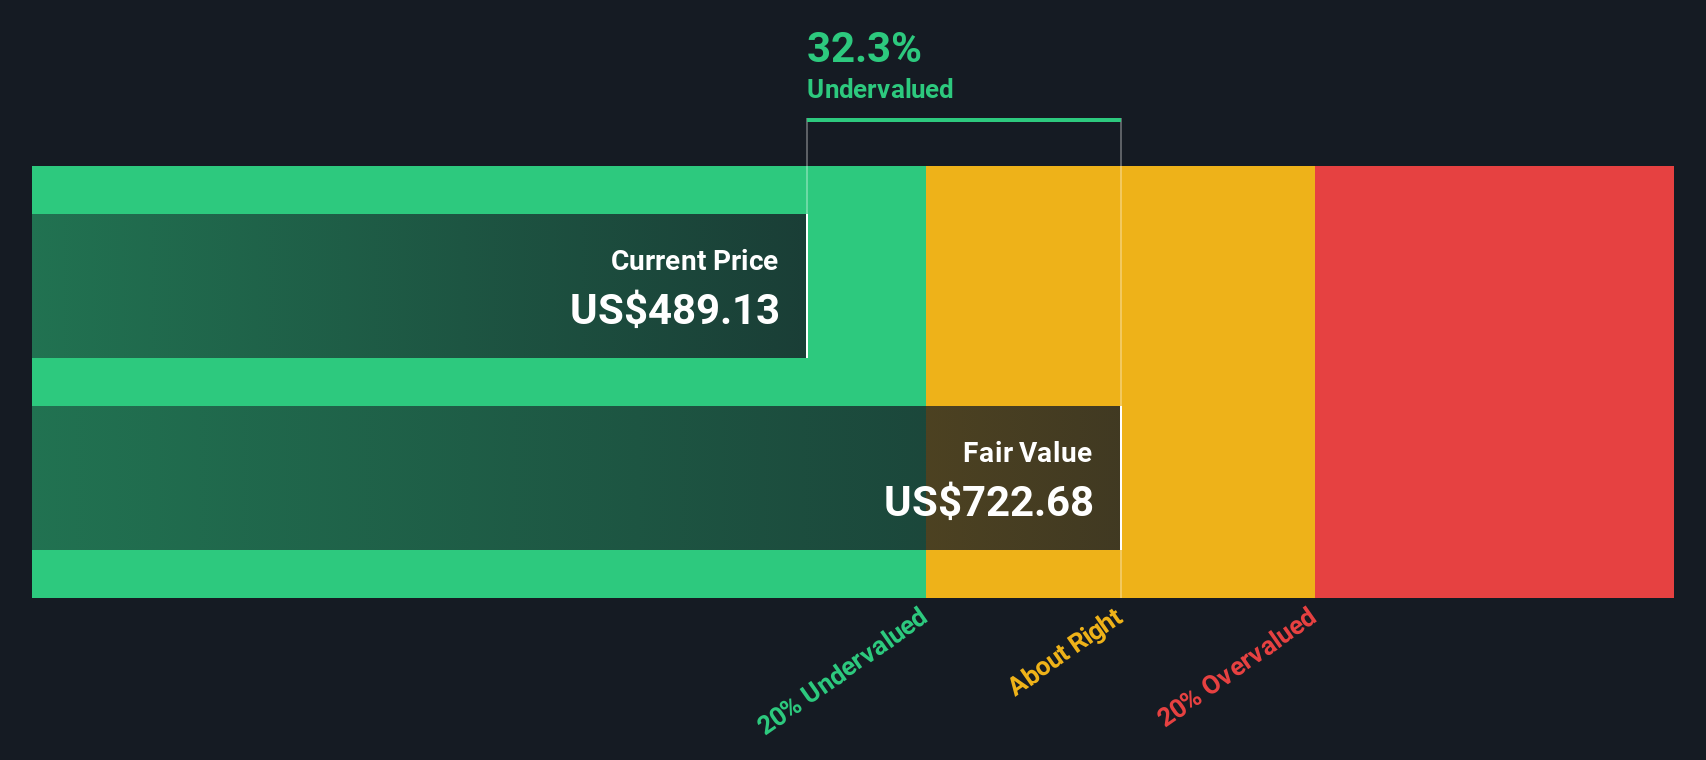
Another View: What Does Our DCF Model Say?
While the price-to-earnings perspective suggests Berkshire Hathaway trades close to fair value, the SWS DCF model offers a striking contrast. According to our DCF estimate, the shares are trading about 32% below intrinsic fair value. Could the market be overlooking Berkshire’s long-term potential, or is the discount justified?
Look into how the SWS DCF model arrives at its fair value.
Simply Wall St performs a discounted cash flow (DCF) on every stock in the world every day (check out Berkshire Hathaway for example). We show the entire calculation in full. You can track the result in your watchlist or portfolio and be alerted when this changes, or use our stock screener to discover undervalued stocks based on their cash flows. If you save a screener we even alert you when new companies match - so you never miss a potential opportunity.
Build Your Own Berkshire Hathaway Narrative
If you see things differently, or want to dig deeper into the numbers, you can craft a personalized Berkshire Hathaway story in just minutes. Do it your way
A great starting point for your Berkshire Hathaway research is our analysis highlighting 1 key reward and 1 important warning sign that could impact your investment decision.
Looking for more investment ideas?
Stay ahead by checking out opportunities you might be missing. The market rewards those who spot trends early and act on emerging themes before the crowd.
- Boost your income with reliable payouts. Tap into these 19 dividend stocks with yields > 3% to access top stocks yielding over 3% annually.
- Gain the AI edge by targeting companies at the intersection of technology and innovation using these 24 AI penny stocks for tomorrow’s winners.
- Go after value others may overlook by uncovering these 898 undervalued stocks based on cash flows that come with the strongest fundamentals and cash flow potential.
This article by Simply Wall St is general in nature. We provide commentary based on historical data and analyst forecasts only using an unbiased methodology and our articles are not intended to be financial advice. It does not constitute a recommendation to buy or sell any stock, and does not take account of your objectives, or your financial situation. We aim to bring you long-term focused analysis driven by fundamental data. Note that our analysis may not factor in the latest price-sensitive company announcements or qualitative material. Simply Wall St has no position in any stocks mentioned.
Valuation is complex, but we're here to simplify it.
Discover if Berkshire Hathaway might be undervalued or overvalued with our detailed analysis, featuring fair value estimates, potential risks, dividends, insider trades, and its financial condition.
Access Free AnalysisHave feedback on this article? Concerned about the content? Get in touch with us directly. Alternatively, email editorial-team@simplywallst.com
About NYSE:BRK.B
Berkshire Hathaway
Through its subsidiaries, engages in the insurance, freight rail transportation, and utility businesses.
Flawless balance sheet and good value.
Similar Companies
Market Insights

Advertisement
Community Narratives
Finding The True Value Of A Logistics Powerhouse
Fair Value US$95.21|8.4% undervalued
NV
Community Contributor
Paradigm Biopharmaceuticals Will Lead Osteoarthritis Treatment with Zilosul's FDA Success
Fair Value AU$5.50|92.1% undervalued
AM
Community Contributor
Barrick Mining (ABX:CA): A Gold Hedge against a U.S. Shutdown
Fair Value CA$60.00|24.2% undervalued
GM
Community Contributor