Advertisement
- United States
- /
- Diversified Financial
- /
- NYSE:BRK.A
Berkshire Hathaway (BRK.A): Examining Valuation After Its Latest Period of Steady Gains

Simply Wall St
Reviewed by Simply Wall St
Berkshire Hathaway (BRK.A) has caught investors' attention lately following another month of steady returns. The company's stock is up about 4% over the past month, which reflects its underlying business momentum.
See our latest analysis for Berkshire Hathaway.
This recent pop comes after a year full of steady progress for Berkshire Hathaway, with the stock’s 1-year total shareholder return of 8.2% and a robust 13% share price gain year-to-date, showing that momentum is very much intact. For an investment that prizes long-term compounding, that three-year total shareholder return of over 63% tells the bigger story of resilience and continued growth, even as broader economic headlines come and go.
If Berkshire’s consistent climb has you rethinking your portfolio’s potential, now is the perfect moment to broaden your focus and discover fast growing stocks with high insider ownership
But with Berkshire Hathaway now trading close to analyst price targets despite its strong run, the key question is whether investors are overlooking further upside or if the current price already reflects all the company’s future potential.
Price-to-Earnings of 16.3x: Is it justified?
Berkshire Hathaway currently trades on a price-to-earnings (P/E) ratio of 16.3x, just above the broader US diversified financials industry but below the average of its largest peers. With the last close at $763,866.71, investors are paying a slight premium compared to the industry, for a stock that has demonstrated resilience over the long run.
The price-to-earnings ratio compares a company's current share price relative to its per-share earnings. For an established holding company like Berkshire Hathaway, the P/E is a quick way to gauge how much the market is willing to pay today for a dollar of tomorrow’s earnings, and whether the stock price truly reflects the earnings power of such a diverse investment portfolio.
While the current P/E here is higher than the industry average (13.2x), it is notably below the peer group average (26.6x) and sits just shy of what is considered the stock's fair P/E ratio (17x). This places Berkshire's valuation at a moderate point among large-cap financials. If the fair ratio is a predictive anchor, the current multiple suggests some room for upside if the company maintains or improves profitability.
Explore the SWS fair ratio for Berkshire Hathaway
Result: Price-to-Earnings of 16.3x (ABOUT RIGHT)
However, revenue growth has slowed and net income has dipped. Both of these factors could challenge future returns if these trends persist.
Find out about the key risks to this Berkshire Hathaway narrative.
Another View: SWS DCF Model Points to Significant Undervaluation
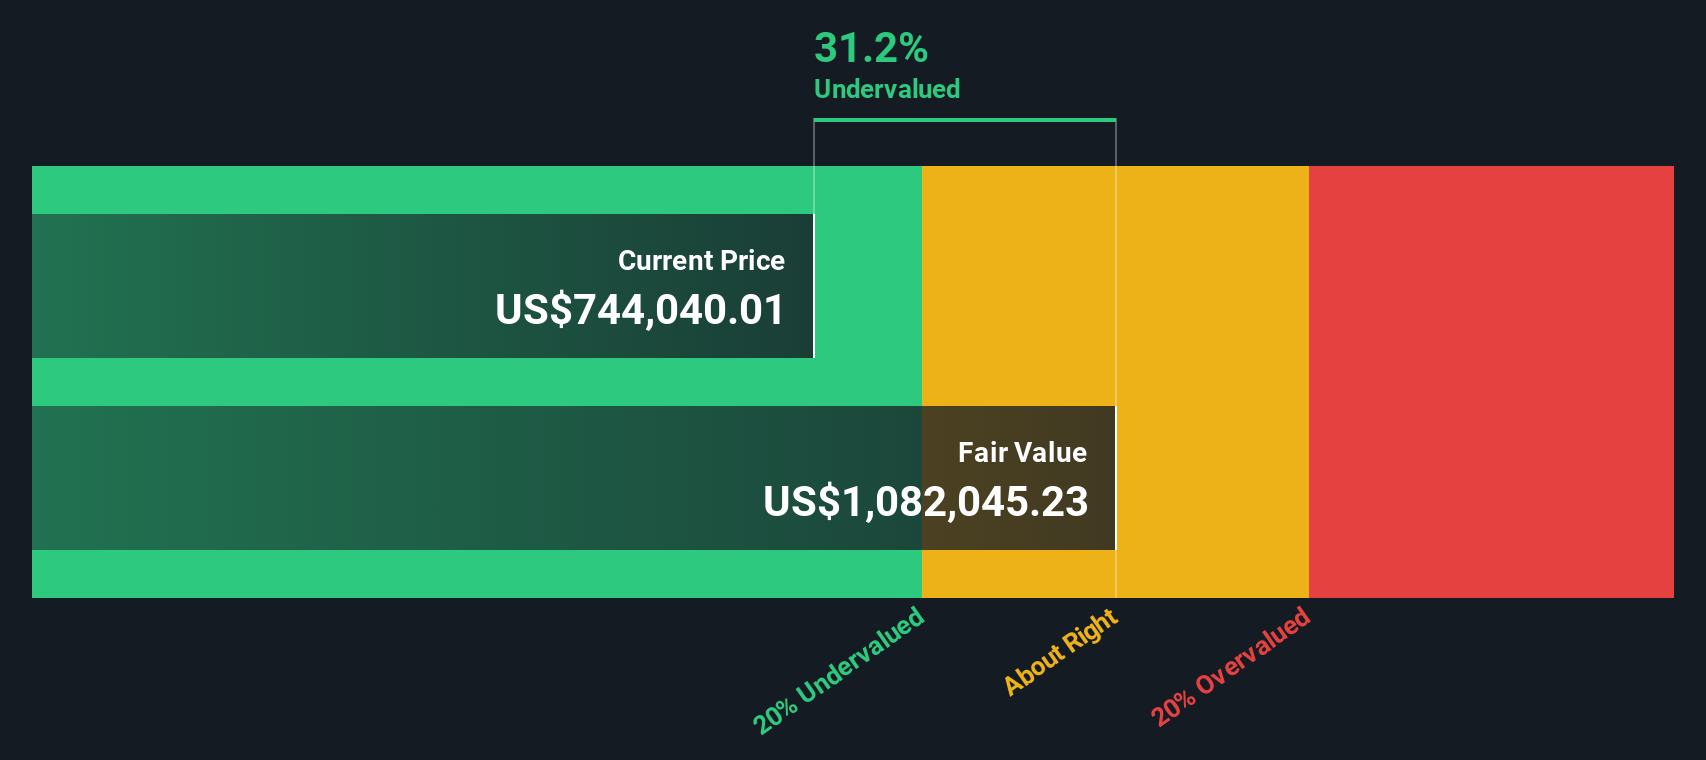
While the price-to-earnings approach suggests Berkshire Hathaway is priced about right, our SWS DCF model presents a different perspective. The DCF calculation estimates the stock's fair value is around $1,154,032, which puts current prices more than 33% below that mark. Could the market be underestimating Berkshire’s potential, or is there a catch?
Look into how the SWS DCF model arrives at its fair value.
Simply Wall St performs a discounted cash flow (DCF) on every stock in the world every day (check out Berkshire Hathaway for example). We show the entire calculation in full. You can track the result in your watchlist or portfolio and be alerted when this changes, or use our stock screener to discover 879 undervalued stocks based on their cash flows. If you save a screener we even alert you when new companies match - so you never miss a potential opportunity.
Build Your Own Berkshire Hathaway Narrative
If you see the story differently or prefer taking research into your own hands, crafting your own analysis takes just a few minutes. Do it your way
A great starting point for your Berkshire Hathaway research is our analysis highlighting 1 key reward and 2 important warning signs that could impact your investment decision.
Looking for more investment ideas?
Expand your investment horizon right now. Fresh opportunities and trends abound, just waiting for you to target the next smart move that fits your goals.
- Boost your portfolio’s yield and secure steady income by checking out these 16 dividend stocks with yields > 3% with high payout potential above 3%.
- Stay ahead of technology trends and ride the AI boom with these 25 AI penny stocks selected for cutting-edge innovation and rapid growth.
- Gain an edge on undervalued gems before others catch on by navigating these 879 undervalued stocks based on cash flows highlighting top stocks with strong cash flow fundamentals.
This article by Simply Wall St is general in nature. We provide commentary based on historical data and analyst forecasts only using an unbiased methodology and our articles are not intended to be financial advice. It does not constitute a recommendation to buy or sell any stock, and does not take account of your objectives, or your financial situation. We aim to bring you long-term focused analysis driven by fundamental data. Note that our analysis may not factor in the latest price-sensitive company announcements or qualitative material. Simply Wall St has no position in any stocks mentioned.
Valuation is complex, but we're here to simplify it.
Discover if Berkshire Hathaway might be undervalued or overvalued with our detailed analysis, featuring fair value estimates, potential risks, dividends, insider trades, and its financial condition.
Access Free AnalysisHave feedback on this article? Concerned about the content? Get in touch with us directly. Alternatively, email editorial-team@simplywallst.com
About NYSE:BRK.A
Berkshire Hathaway
Through its subsidiaries, engages in the insurance, freight rail transportation, and utility businesses.
Flawless balance sheet and good value.
Similar Companies
Market Insights

Advertisement
Community Narratives
MINISO's fair value is projected at 26.69 with an anticipated PE ratio shift of 20x
Fair Value US$24.03|11.0% undervalued
BE
Community Contributor
Procter & Gamble: A Dividend Giant Facing Slowing Growth
Fair Value US$119.81|23.3% overvalued
AN
Community Contributor
Eli Lilly's Future Growth Driven by Tirzepatide and Favorable Market Conditions
Fair Value US$1.19k|13.8% undervalued
EA
Community Contributor