- United States
- /
- Mortgage REITs
- /
- NYSE:ARI
Market is not liking Apollo Commercial Real Estate Finance's (NYSE:ARI) earnings decline as stock retreats 4.1% this week


In order to justify the effort of selecting individual stocks, it's worth striving to beat the returns from a market index fund. But in any portfolio, there will be mixed results between individual stocks. So we wouldn't blame long term Apollo Commercial Real Estate Finance, Inc. (NYSE:ARI) shareholders for doubting their decision to hold, with the stock down 50% over a half decade. Even worse, it's down 9.4% in about a month, which isn't fun at all.
After losing 4.1% this past week, it's worth investigating the company's fundamentals to see what we can infer from past performance.
See our latest analysis for Apollo Commercial Real Estate Finance
To paraphrase Benjamin Graham: Over the short term the market is a voting machine, but over the long term it's a weighing machine. By comparing earnings per share (EPS) and share price changes over time, we can get a feel for how investor attitudes to a company have morphed over time.
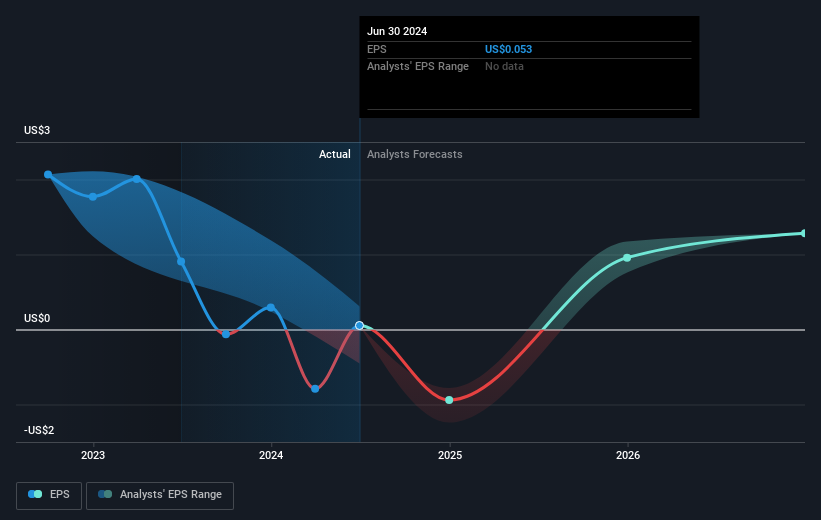
During the five years over which the share price declined, Apollo Commercial Real Estate Finance's earnings per share (EPS) dropped by 49% each year. This fall in the EPS is worse than the 13% compound annual share price fall. So investors might expect EPS to bounce back -- or they may have previously foreseen the EPS decline. With a P/E ratio of 174.02, it's fair to say the market sees a brighter future for the business.
The graphic below depicts how EPS has changed over time (unveil the exact values by clicking on the image).
We're pleased to report that the CEO is remunerated more modestly than most CEOs at similarly capitalized companies. But while CEO remuneration is always worth checking, the really important question is whether the company can grow earnings going forward. It might be well worthwhile taking a look at our free report on Apollo Commercial Real Estate Finance's earnings, revenue and cash flow.
What About Dividends?
It is important to consider the total shareholder return, as well as the share price return, for any given stock. The TSR is a return calculation that accounts for the value of cash dividends (assuming that any dividend received was reinvested) and the calculated value of any discounted capital raisings and spin-offs. It's fair to say that the TSR gives a more complete picture for stocks that pay a dividend. In the case of Apollo Commercial Real Estate Finance, it has a TSR of -8.2% for the last 5 years. That exceeds its share price return that we previously mentioned. And there's no prize for guessing that the dividend payments largely explain the divergence!
A Different Perspective
Apollo Commercial Real Estate Finance provided a TSR of 1.7% over the last twelve months. Unfortunately this falls short of the market return. But at least that's still a gain! Over five years the TSR has been a reduction of 1.6% per year, over five years. It could well be that the business is stabilizing. While it is well worth considering the different impacts that market conditions can have on the share price, there are other factors that are even more important. To that end, you should learn about the 4 warning signs we've spotted with Apollo Commercial Real Estate Finance (including 1 which is concerning) .
If you would prefer to check out another company -- one with potentially superior financials -- then do not miss this free list of companies that have proven they can grow earnings.
Please note, the market returns quoted in this article reflect the market weighted average returns of stocks that currently trade on American exchanges.
New: Manage All Your Stock Portfolios in One Place
We've created the ultimate portfolio companion for stock investors, and it's free.
• Connect an unlimited number of Portfolios and see your total in one currency
• Be alerted to new Warning Signs or Risks via email or mobile
• Track the Fair Value of your stocks
Have feedback on this article? Concerned about the content? Get in touch with us directly. Alternatively, email editorial-team (at) simplywallst.com.
This article by Simply Wall St is general in nature. We provide commentary based on historical data and analyst forecasts only using an unbiased methodology and our articles are not intended to be financial advice. It does not constitute a recommendation to buy or sell any stock, and does not take account of your objectives, or your financial situation. We aim to bring you long-term focused analysis driven by fundamental data. Note that our analysis may not factor in the latest price-sensitive company announcements or qualitative material. Simply Wall St has no position in any stocks mentioned.
About NYSE:ARI
Apollo Commercial Real Estate Finance
Apollo Commercial Real Estate Finance, Inc.
Moderate growth potential second-rate dividend payer.

