
Advertisement
- United States
- /
- Capital Markets
- /
- NasdaqGS:XP
Shareholders in XP (NASDAQ:XP) are in the red if they invested five years ago

XP Inc. (NASDAQ:XP) shareholders will doubtless be very grateful to see the share price up 31% in the last quarter. But that can't change the reality that over the longer term (five years), the returns have been really quite dismal. Indeed, the share price is down 57% in the period. Some might say the recent bounce is to be expected after such a bad drop. Of course, this could be the start of a turnaround.
Since shareholders are down over the longer term, lets look at the underlying fundamentals over the that time and see if they've been consistent with returns.
There is no denying that markets are sometimes efficient, but prices do not always reflect underlying business performance. By comparing earnings per share (EPS) and share price changes over time, we can get a feel for how investor attitudes to a company have morphed over time.
During the unfortunate half decade during which the share price slipped, XP actually saw its earnings per share (EPS) improve by 30% per year. So it doesn't seem like EPS is a great guide to understanding how the market is valuing the stock. Or possibly, the market was previously very optimistic, so the stock has disappointed, despite improving EPS.
Due to the lack of correlation between the EPS growth and the falling share price, it's worth taking a look at other metrics to try to understand the share price movement.
The steady dividend doesn't really explain why the share price is down. While it's not completely obvious why the share price is down, a closer look at the company's history might help explain it.
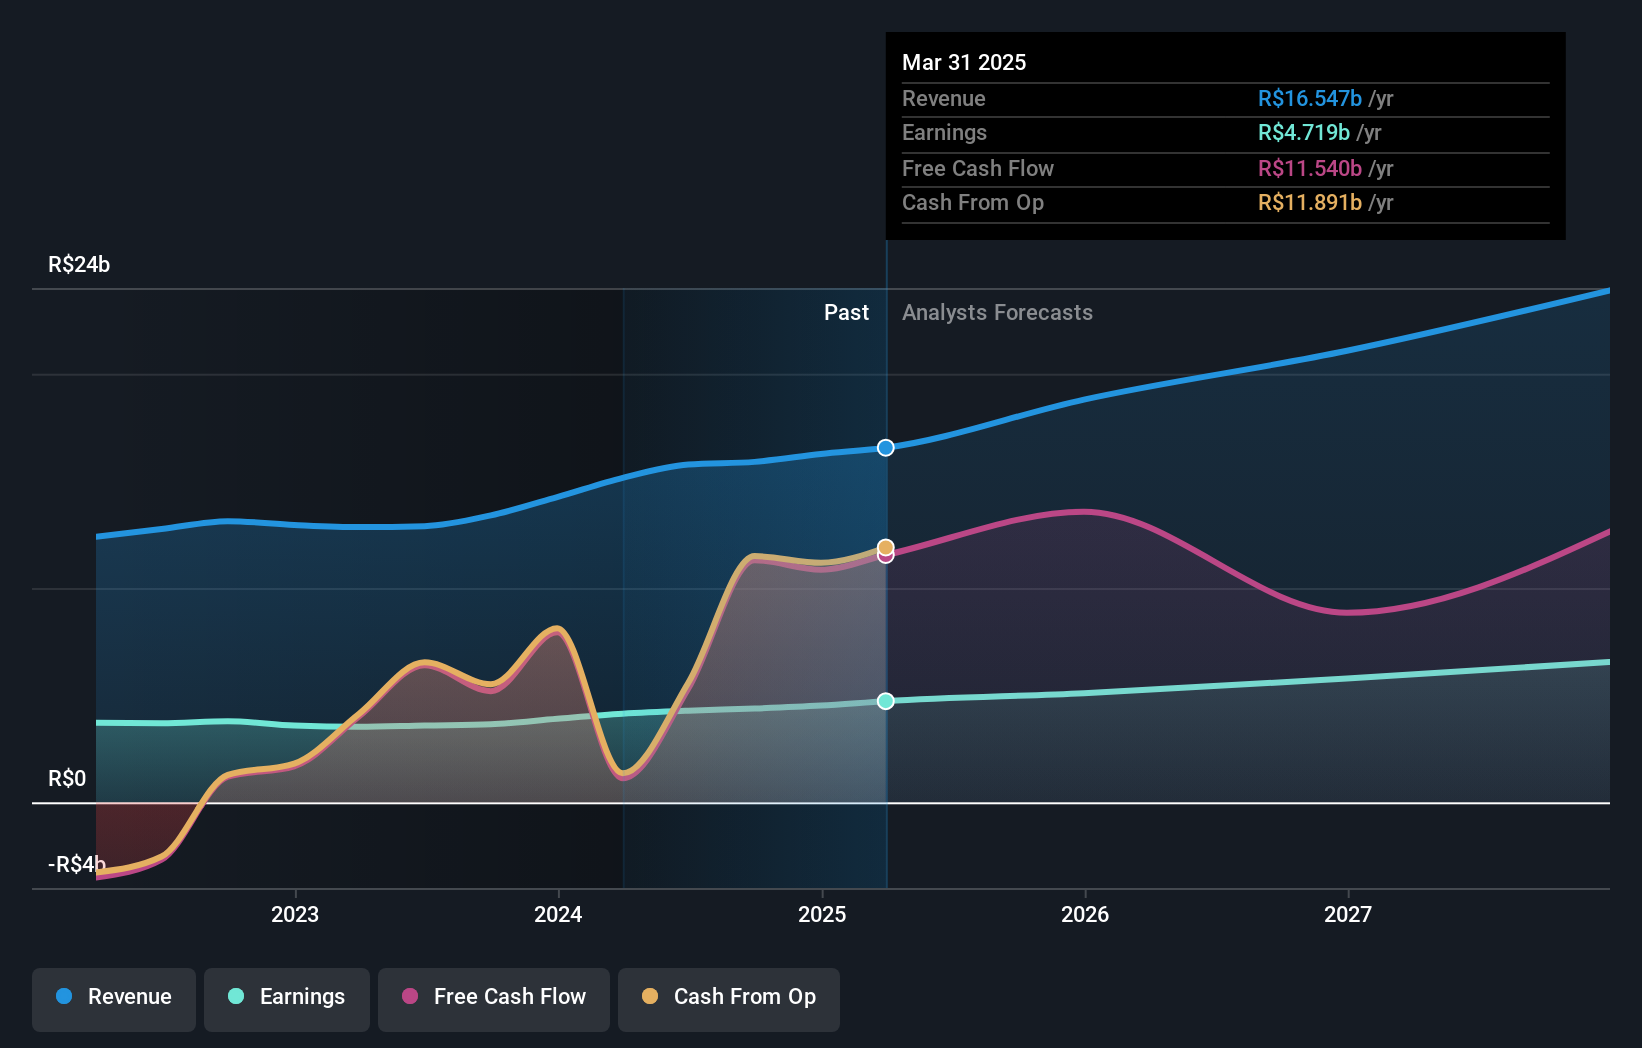
The graphic below depicts how earnings and revenue have changed over time (unveil the exact values by clicking on the image).
XP is a well known stock, with plenty of analyst coverage, suggesting some visibility into future growth. If you are thinking of buying or selling XP stock, you should check out this free report showing analyst consensus estimates for future profits.
What About Dividends?
It is important to consider the total shareholder return, as well as the share price return, for any given stock. The TSR incorporates the value of any spin-offs or discounted capital raisings, along with any dividends, based on the assumption that the dividends are reinvested. Arguably, the TSR gives a more comprehensive picture of the return generated by a stock. We note that for XP the TSR over the last 5 years was -52%, which is better than the share price return mentioned above. And there's no prize for guessing that the dividend payments largely explain the divergence!
A Different Perspective
XP's TSR for the year was broadly in line with the market average, at 13%. The silver lining is that the share price is up in the short term, which flies in the face of the annualised loss of 9% over the last five years. While 'turnarounds seldom turn' there are green shoots for XP. Keeping this in mind, a solid next step might be to take a look at XP's dividend track record. This free interactive graph is a great place to start.
Of course, you might find a fantastic investment by looking elsewhere. So take a peek at this free list of companies we expect will grow earnings.
Please note, the market returns quoted in this article reflect the market weighted average returns of stocks that currently trade on American exchanges.
New: AI Stock Screener & Alerts
Our new AI Stock Screener scans the market every day to uncover opportunities.
• Dividend Powerhouses (3%+ Yield)
• Undervalued Small Caps with Insider Buying
• High growth Tech and AI Companies
Or build your own from over 50 metrics.
Have feedback on this article? Concerned about the content? Get in touch with us directly. Alternatively, email editorial-team (at) simplywallst.com.
This article by Simply Wall St is general in nature. We provide commentary based on historical data and analyst forecasts only using an unbiased methodology and our articles are not intended to be financial advice. It does not constitute a recommendation to buy or sell any stock, and does not take account of your objectives, or your financial situation. We aim to bring you long-term focused analysis driven by fundamental data. Note that our analysis may not factor in the latest price-sensitive company announcements or qualitative material. Simply Wall St has no position in any stocks mentioned.
About NasdaqGS:XP
Good value with proven track record and pays a dividend.
Similar Companies
Market Insights


Advertisement
Community Narratives
A case for TSXV:USA to reach USD $5.00 - $9.00 (CAD $7.30–$12.29) by 2029.
Fair Value CA$12.29|90.8% undervalued
AG
Community Contributor
DLocal's Future Growth Fueled by 35% Revenue and Profit Margin Boosts
Fair Value US$195.39|94.2% undervalued
WY
Community Contributor
Historically Cheap, but the Margin of Safety Is Still Thin
Fair Value SEK 232.58|15.9% undervalued
MA
Community Contributor