Advertisement
- United States
- /
- Capital Markets
- /
- NasdaqGS:TROW
Does the Recent Earnings Beat Signal a New Opportunity in T. Rowe Price for 2025?

Simply Wall St
Reviewed by Bailey Pemberton
If you’re looking at T. Rowe Price Group and wondering whether to stay, sell, or jump in fresh, you’re not alone. With markets moving the way they have and investment sentiment swinging from optimism to wariness, it’s only natural to weigh your next move carefully. T. Rowe Price’s recent track record offers plenty of talking points: after a slight stumble over the past month, the stock has held steady, closing at $103.7, and has even posted a 2.2% gain in the last week. Still, year to date the shares are down 8.6%. Over the past three years, though, the company boasts a 16.2% gain, despite a negative run in the five-year window that leaves it off 13.4%. These ups and downs highlight how market-wide dynamics, including shifts in investor appetite for asset managers, continue to impact T. Rowe Price’s perceived value and risk profile.
With so much noise, it makes sense to focus on the core question: is T. Rowe Price Group undervalued by the market right now? According to six common valuation checks, the company scores a 5 out of 6, suggesting it could be a compelling buy for the right investor. But not all valuation methods tell the same story, and some offer deeper perspective than others. Let’s break down how each approach stacks up, and stick around; there’s an even smarter way to judge value coming up at the end.
Approach 1: T. Rowe Price Group Excess Returns Analysis
The Excess Returns model focuses on how effectively a company puts its capital to work, measuring the value created over and above the cost of equity. In other words, it asks whether T. Rowe Price is delivering profitable returns compared to what investors demand for the risk they take owning the stock.
For T. Rowe Price Group, the latest analysis shows a Book Value of $48.02 per share and a Stable EPS of $9.85 per share, based on weighted future Return on Equity estimates from six analysts. The company’s average Return on Equity stands at a robust 19.49%, while the calculated Cost of Equity is $4.08 per share. The resulting Excess Return, the amount by which returns exceed cost, is $5.77 per share. Over the long term, the company is projected to maintain a Stable Book Value of $50.54 per share, sourced from future estimates by three analysts.
Based on this approach, the estimated intrinsic value per share is $166.05. That is a substantial 37.5% discount to the current share price, meaning the stock appears significantly undervalued according to this model.
Result: UNDERVALUED
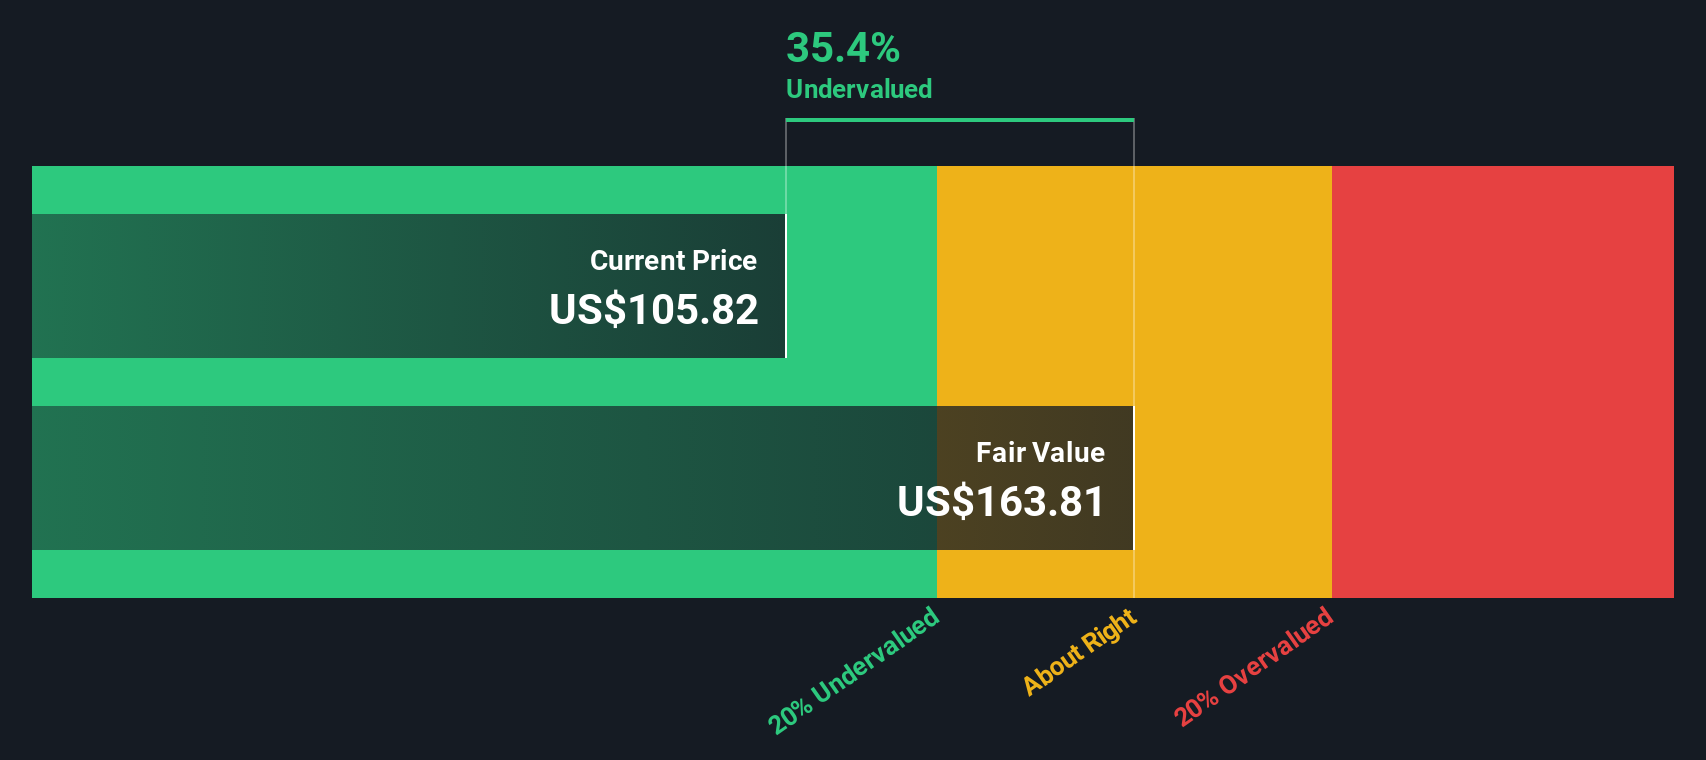
Our Excess Returns analysis suggests T. Rowe Price Group is undervalued by 37.5%. Track this in your watchlist or portfolio, or discover more undervalued stocks.
Approach 2: T. Rowe Price Group Price vs Earnings
The price-to-earnings (PE) ratio is a widely used metric for valuing profitable companies like T. Rowe Price Group, as it links the company’s current share price to its earnings power. For established asset managers, the PE ratio reflects the market’s expectations for future growth, profitability, and associated risks. Higher growth prospects or lower perceived risks typically justify a higher PE, while uncertainty or slow growth can pull it down.
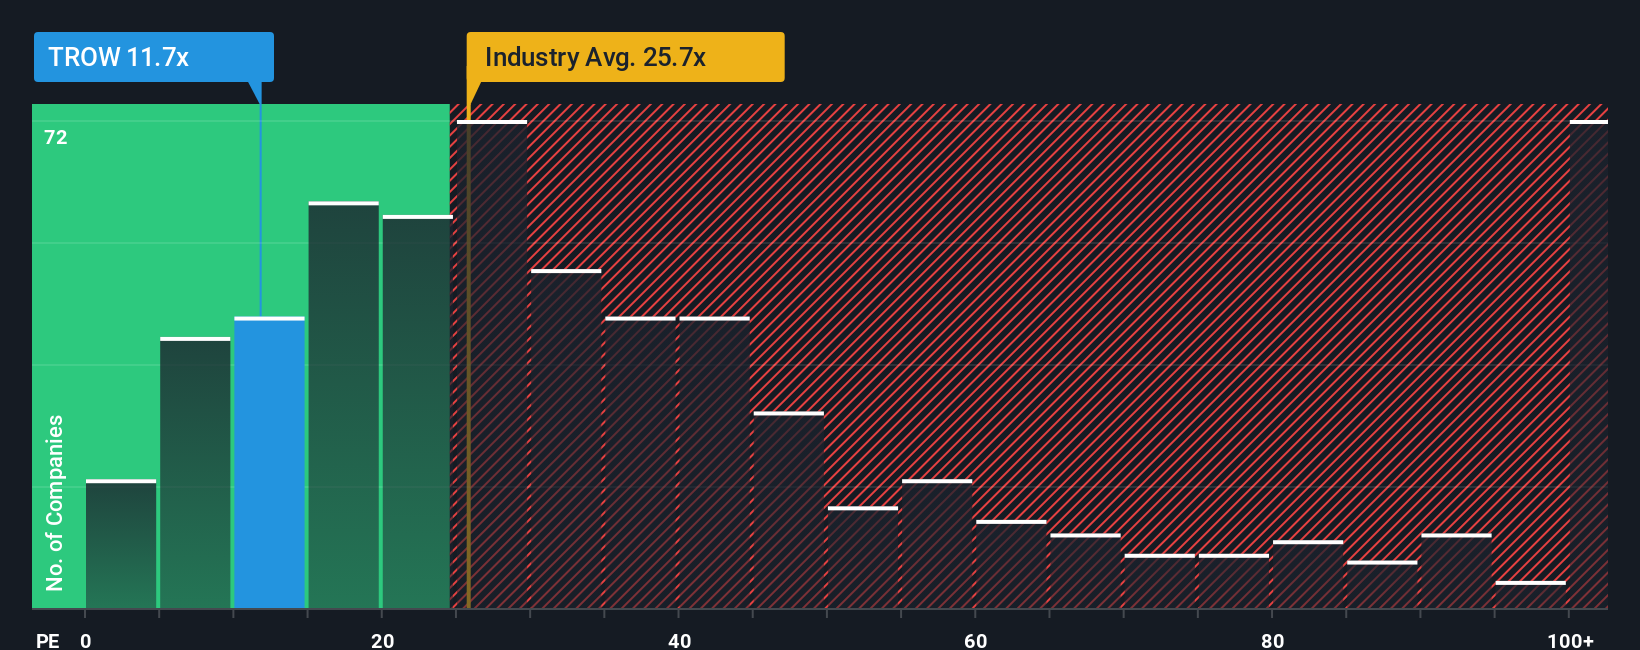
Right now, T. Rowe Price Group trades at a PE of 11.5x. That is substantially lower than the Capital Markets industry average of 25.1x and the peer group average of 21.3x. At first glance, this might make the stock look like a bargain among its competitors. However, headline multiples can be misleading if they do not adjust for specific company dynamics.
Here is where Simply Wall St’s “Fair Ratio” comes in. This metric reflects a PE that is custom-tailored to T. Rowe Price’s unique blend of expected earnings growth, risk factors, profit margin, industry, and market cap. It offers a more precise baseline than a one-size-fits-all industry or peer average. For T. Rowe Price, the Fair Ratio comes out at 15.9x. Since the current PE of 11.5x is meaningfully below this level, it suggests the market may be undervaluing the stock’s underlying fundamentals.
Result: UNDERVALUED
PE ratios tell one story, but what if the real opportunity lies elsewhere? Discover companies where insiders are betting big on explosive growth.
Upgrade Your Decision Making: Choose your T. Rowe Price Group Narrative
Earlier we mentioned there is an even better way to understand valuation, so let’s introduce you to Narratives. Narratives let you build a story behind the numbers by combining your beliefs about T. Rowe Price Group’s future revenue, earnings, and profit margins with a forecasted fair value, all in one place. This approach makes investing more personal and practical, as it links your take on the company’s journey to real financial outcomes and shows you how your story translates to a buy, sell, or hold decision.
Narratives are an easy and accessible tool, available to millions of investors on Simply Wall St’s Community page, empowering you to compare the current share price to your own or the consensus Fair Value. Every Narrative is kept up to date as new developments, earnings results, or news hits the market, so your outlook always reflects the latest landscape.
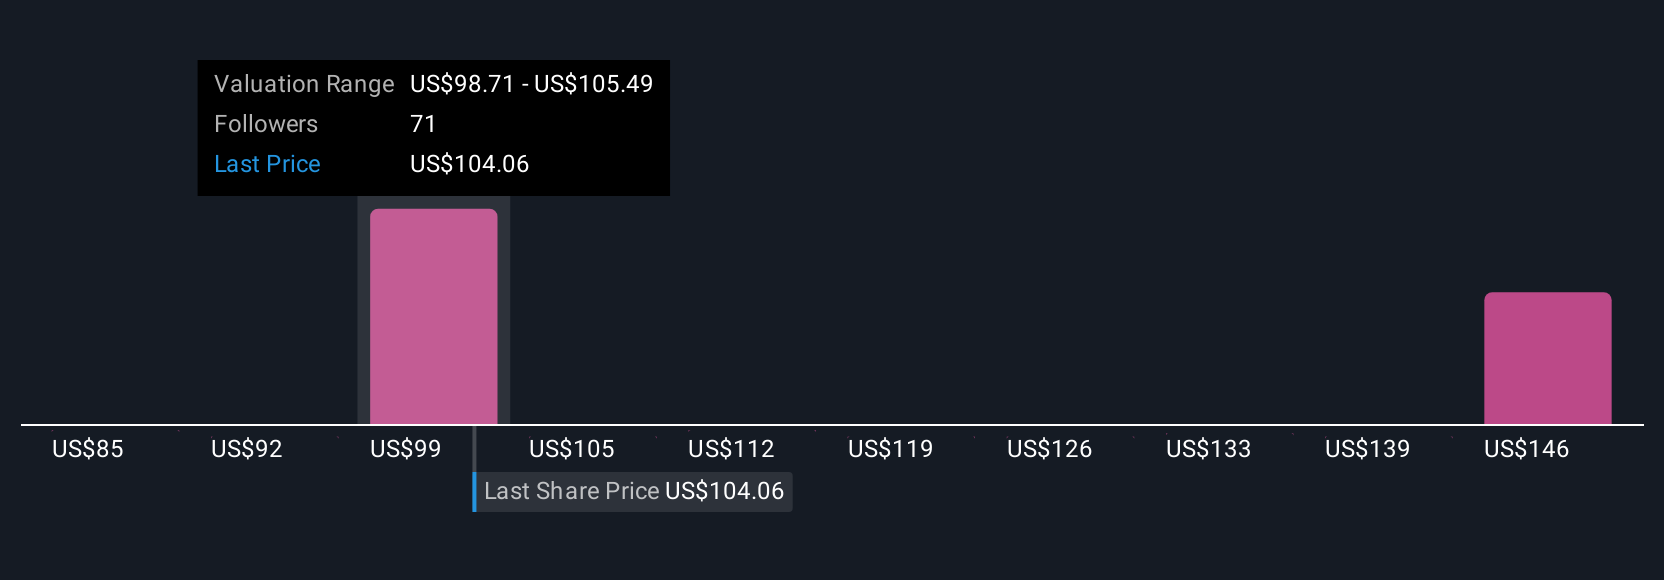
For example, on T. Rowe Price Group, some investors are optimistic and set their Narrative with a fair value of $116 by focusing on innovation in retirement and ETF products, while others are more cautious and assign a value as low as $91, citing continued competition and fee pressures. Each Narrative presents a clear, dynamic guide to help you navigate your next move with confidence.
Do you think there's more to the story for T. Rowe Price Group? Create your own Narrative to let the Community know!
This article by Simply Wall St is general in nature. We provide commentary based on historical data and analyst forecasts only using an unbiased methodology and our articles are not intended to be financial advice. It does not constitute a recommendation to buy or sell any stock, and does not take account of your objectives, or your financial situation. We aim to bring you long-term focused analysis driven by fundamental data. Note that our analysis may not factor in the latest price-sensitive company announcements or qualitative material. Simply Wall St has no position in any stocks mentioned.
Valuation is complex, but we're here to simplify it.
Discover if T. Rowe Price Group might be undervalued or overvalued with our detailed analysis, featuring fair value estimates, potential risks, dividends, insider trades, and its financial condition.
Access Free AnalysisHave feedback on this article? Concerned about the content? Get in touch with us directly. Alternatively, email editorial-team@simplywallst.com
About NasdaqGS:TROW
Undervalued with excellent balance sheet and pays a dividend.
Similar Companies
Market Insights

Advertisement
Community Narratives
Kodiak AI - a potential 100 bagger opportunity?
Fair Value US$14.00|41.9% undervalued
DA
Community Contributor
A Fair Price for a Great Business Facing Real Threats
Fair Value US$383.06|13.0% undervalued
IM
Community Contributor
AXON And Shopify Integration Will Unlock Global Mobile Advertising
Fair Value US$613.59|2.3% undervalued
AN
Based on Analyst Price Targets