- United States
- /
- Capital Markets
- /
- NasdaqGS:TROW
Does T. Rowe Price Still Offer Value After Modest Gains and Fee Pressure Concerns?

Reviewed by Bailey Pemberton
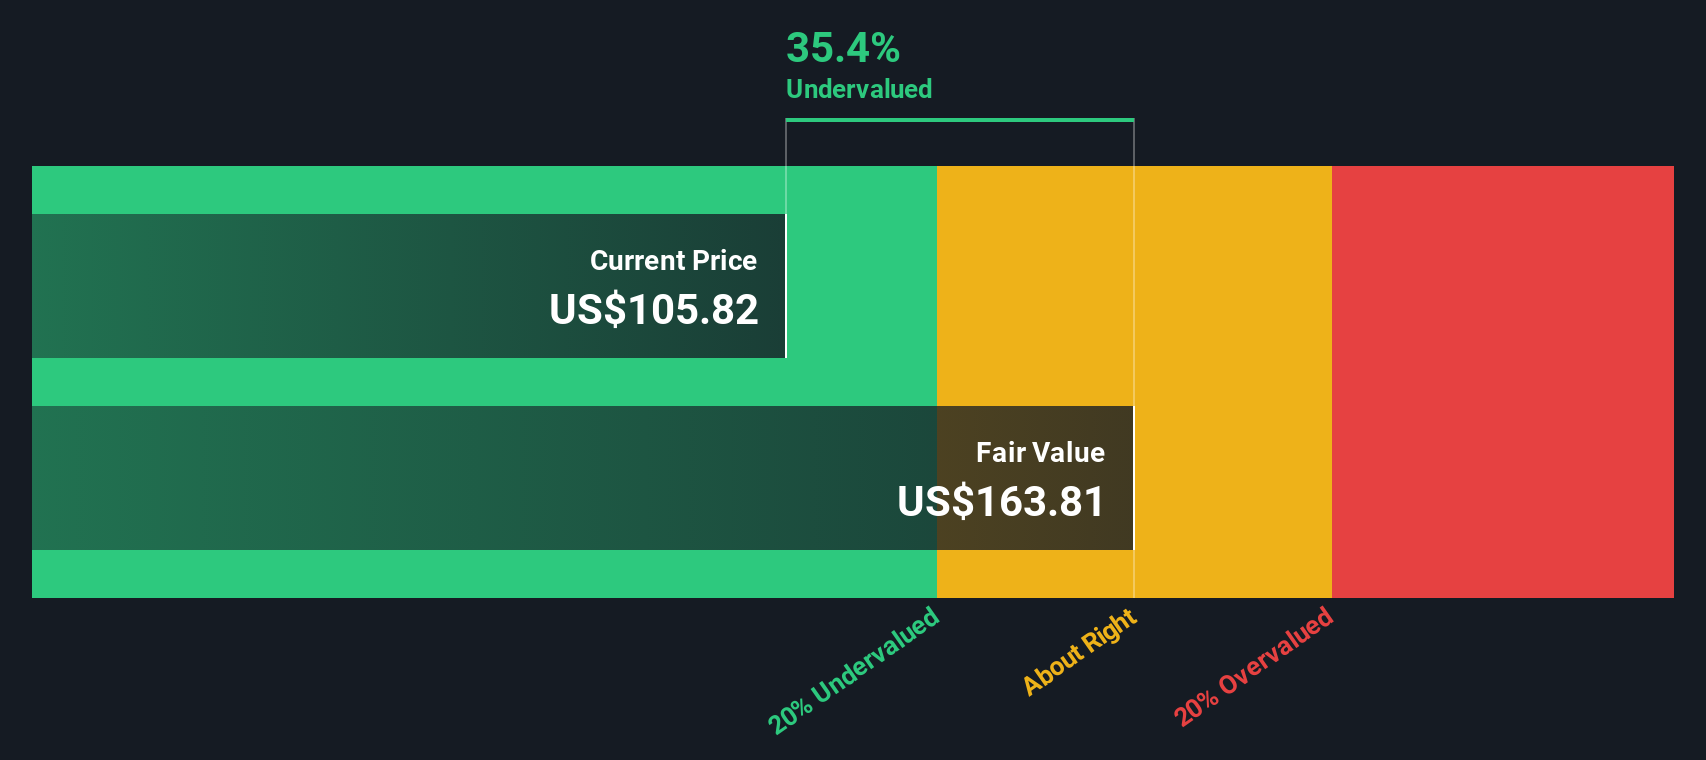
- If you are wondering whether T. Rowe Price Group at around $103.91 is a bargain or a value trap right now, this breakdown is for you if you care about what you are really paying for future cash flows.
- The stock has inched up about 0.3% over the last week and 6.7% over the last month, but it is still down roughly 8.4% year to date and 3.0% over the past year, which hints at shifting sentiment rather than a runaway rally.
- Recently, investors have been digesting headlines around fee pressure across active asset managers and the ongoing tug of war between active and passive investing. Both of these trends directly shape expectations for T. Rowe Price's long term profitability. At the same time, discussions around market volatility, retirement savings flows, and the resilience of long standing asset managers have kept the stock in focus as a potential steady compounder rather than a high octane growth story.
- On our checklist based valuation framework, T. Rowe Price Group scores a strong 5 out of 6 for being undervalued. This sets the stage for a deeper dive into DCFs, multiples, and yield based metrics. Later on, we will look at an even more intuitive way to tie all of these valuation angles together.
Find out why T. Rowe Price Group's -3.0% return over the last year is lagging behind its peers.
Approach 1: T. Rowe Price Group Excess Returns Analysis
The Excess Returns model looks at how much profit a company can generate over and above the return that shareholders demand on their equity, then capitalizes those surplus profits into an intrinsic value per share.
For T. Rowe Price Group, the model starts with a Book Value of $49.45 per share and a Stable EPS of $8.84 per share, based on weighted future Return on Equity estimates from 4 analysts. With an Average Return on Equity of 17.94% and a Stable Book Value of $49.30 per share, drawn from 3 analysts, the business is expected to keep earning attractive returns on its equity base.
The Cost of Equity is estimated at $4.00 per share, while the Excess Return comes in at $4.84 per share, implying that T. Rowe Price is forecast to earn meaningfully more than investors require. Capitalizing these excess returns leads to an intrinsic value of about $148.77 per share, which is roughly 30.2% above the current price.
On this basis, T. Rowe Price Group appears undervalued rather than a value trap.
Result: UNDERVALUED
Our Excess Returns analysis suggests T. Rowe Price Group is undervalued by 30.2%. Track this in your watchlist or portfolio, or discover 913 more undervalued stocks based on cash flows.
Approach 2: T. Rowe Price Group Price vs Earnings
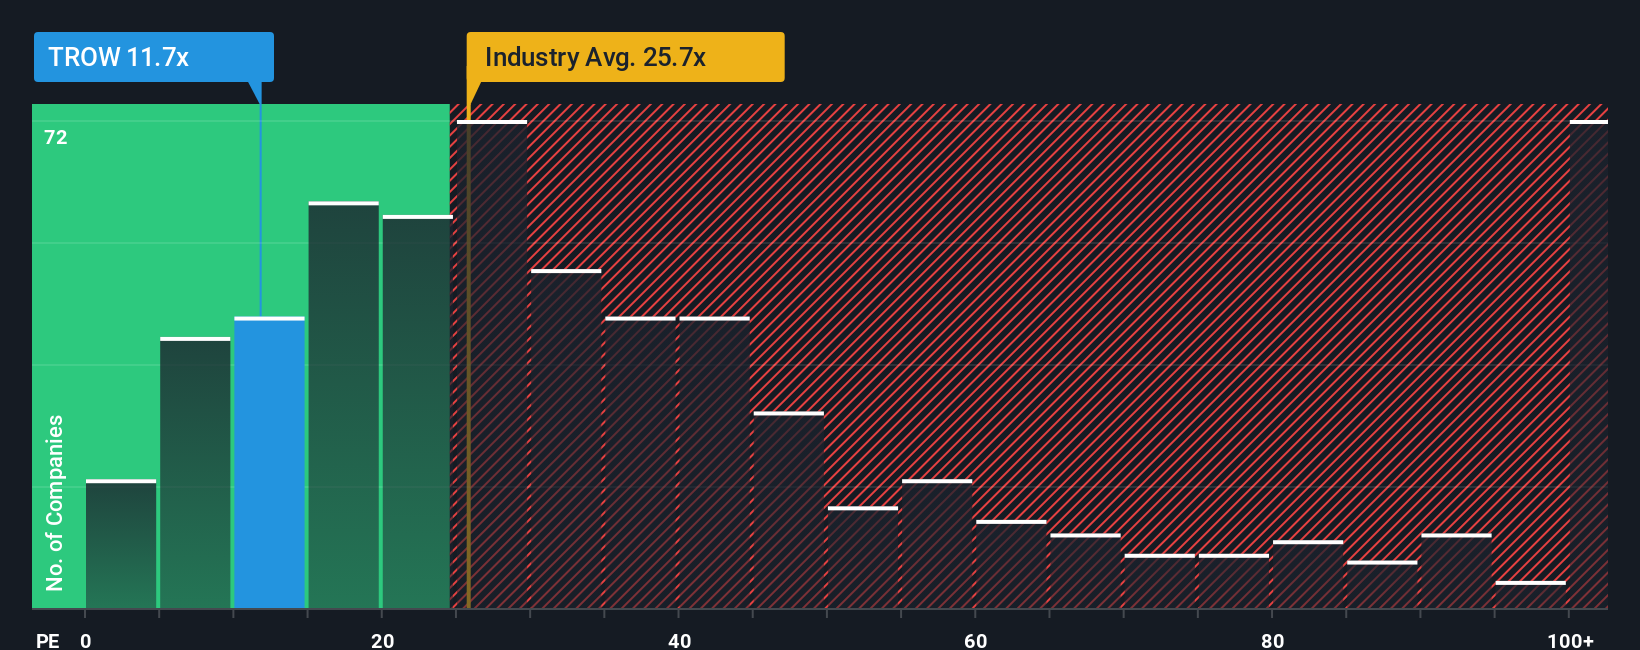
For a mature, consistently profitable business like T. Rowe Price Group, the price to earnings ratio is a practical way to gauge what investors are paying for each dollar of current earnings. In general, companies with stronger growth prospects and lower perceived risk tend to justify higher PE ratios, while slower growth or higher volatility usually call for a discount.
T. Rowe Price currently trades on a PE of about 11.2x, which sits well below both the Capital Markets industry average of roughly 25.5x and the peer group average of about 21.6x. Simply Wall St also calculates a proprietary “Fair Ratio” of 15.7x for TROW, which estimates the PE the stock should trade at given its specific mix of earnings growth, profitability, industry, market cap and risk profile.
This Fair Ratio is more tailored than a simple comparison with peers or the industry, because it adjusts for company level strengths and weaknesses rather than assuming all asset managers deserve the same multiple. With TROW trading at 11.2x versus a Fair Ratio of 15.7x, the shares appear to be priced below that Fair Ratio on an earnings basis.
Result: UNDERVALUED
PE ratios tell one story, but what if the real opportunity lies elsewhere? Discover 1462 companies where insiders are betting big on explosive growth.
Upgrade Your Decision Making: Choose your T. Rowe Price Group Narrative
Earlier we mentioned that there is an even better way to understand valuation, so let us introduce you to Narratives, which are simple stories that express your view of a company and link that story to a set of assumptions about future revenue, earnings, margins, and ultimately Fair Value. Narratives on Simply Wall St, available to millions of investors via the Community page, turn your perspective into a structured forecast and then compare the Fair Value that drops out of that forecast with today’s share price, helping you decide whether T. Rowe Price Group is a buy, hold, or sell. Because Narratives update dynamically when new information arrives, such as earnings releases, product launches, or news about flows and fee pressure, your view stays live rather than static. For T. Rowe Price Group, for example, a more optimistic Narrative might lean toward the upper end of recent targets around $115, assuming that innovation in retirement products, ETFs, and global expansion successfully lifts revenue and margins. In contrast, a more cautious Narrative might sit near $97, emphasizing fee compression, persistent outflows, and competitive threats to the traditional active management model.
Do you think there's more to the story for T. Rowe Price Group? Head over to our Community to see what others are saying!

This article by Simply Wall St is general in nature. We provide commentary based on historical data and analyst forecasts only using an unbiased methodology and our articles are not intended to be financial advice. It does not constitute a recommendation to buy or sell any stock, and does not take account of your objectives, or your financial situation. We aim to bring you long-term focused analysis driven by fundamental data. Note that our analysis may not factor in the latest price-sensitive company announcements or qualitative material. Simply Wall St has no position in any stocks mentioned.
Mobile Infrastructure for Defense and Disaster
The next wave in robotics isn't humanoid. Its fully autonomous towers delivering 5G, ISR, and radar in under 30 minutes, anywhere.
Get the investor briefing before the next round of contracts
Sponsored On Behalf of CiTechValuation is complex, but we're here to simplify it.
Discover if T. Rowe Price Group might be undervalued or overvalued with our detailed analysis, featuring fair value estimates, potential risks, dividends, insider trades, and its financial condition.
Access Free AnalysisHave feedback on this article? Concerned about the content? Get in touch with us directly. Alternatively, email editorial-team@simplywallst.com
About NasdaqGS:TROW
Undervalued with excellent balance sheet and pays a dividend.
Similar Companies
Market Insights

Weekly Picks

Early mover in a fast growing industry. Likely to experience share price volatility as they scale


A case for CA$31.80 (undiluted), aka 8,616% upside from CA$0.37 (an 86 bagger!).


Moderation and Stabilisation: HOLD: Fair Price based on a 4-year Cycle is $12.08
Recently Updated Narratives


An amazing opportunity to potentially get a 100 bagger

Amazon: Why the World’s Biggest Platform Still Runs on Invisible Economics

Sunrun Stock: When the Energy Transition Collides With the Cost of Capital
Popular Narratives


MicroVision will explode future revenue by 380.37% with a vision towards success


Crazy Undervalued 42 Baggers Silver Play (Active & Running Mine)

