
Advertisement
- United States
- /
- Capital Markets
- /
- NasdaqGS:TPG
Benign Growth For TPG Inc. (NASDAQ:TPG) Underpins Stock's 26% Plummet
To the annoyance of some shareholders, TPG Inc. (NASDAQ:TPG) shares are down a considerable 26% in the last month, which continues a horrid run for the company. The last month has meant the stock is now only up 5.5% during the last year.
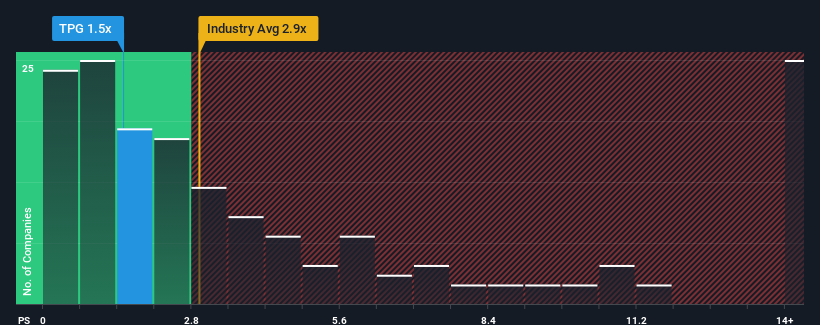
Following the heavy fall in price, TPG may be sending buy signals at present with its price-to-sales (or "P/S") ratio of 1.5x, considering almost half of all companies in the Capital Markets industry in the United States have P/S ratios greater than 2.9x and even P/S higher than 8x aren't out of the ordinary. Nonetheless, we'd need to dig a little deeper to determine if there is a rational basis for the reduced P/S.
Check out our latest analysis for TPG
How Has TPG Performed Recently?
Recent times have been advantageous for TPG as its revenues have been rising faster than most other companies. Perhaps the market is expecting future revenue performance to dive, which has kept the P/S suppressed. If not, then existing shareholders have reason to be quite optimistic about the future direction of the share price.
If you'd like to see what analysts are forecasting going forward, you should check out our free report on TPG.What Are Revenue Growth Metrics Telling Us About The Low P/S?
There's an inherent assumption that a company should underperform the industry for P/S ratios like TPG's to be considered reasonable.
Taking a look back first, we see that the company grew revenue by an impressive 46% last year. However, this wasn't enough as the latest three year period has seen the company endure a nasty 30% drop in revenue in aggregate. Accordingly, shareholders would have felt downbeat about the medium-term rates of revenue growth.
Looking ahead now, revenue is anticipated to slump, contracting by 6.6% each year during the coming three years according to the nine analysts following the company. Meanwhile, the broader industry is forecast to expand by 7.5% per annum, which paints a poor picture.
In light of this, it's understandable that TPG's P/S would sit below the majority of other companies. Nonetheless, there's no guarantee the P/S has reached a floor yet with revenue going in reverse. Even just maintaining these prices could be difficult to achieve as the weak outlook is weighing down the shares.
What Does TPG's P/S Mean For Investors?
The southerly movements of TPG's shares means its P/S is now sitting at a pretty low level. We'd say the price-to-sales ratio's power isn't primarily as a valuation instrument but rather to gauge current investor sentiment and future expectations.
With revenue forecasts that are inferior to the rest of the industry, it's no surprise that TPG's P/S is on the lower end of the spectrum. Right now shareholders are accepting the low P/S as they concede future revenue probably won't provide any pleasant surprises. Unless these conditions improve, they will continue to form a barrier for the share price around these levels.
We don't want to rain on the parade too much, but we did also find 1 warning sign for TPG that you need to be mindful of.
Of course, profitable companies with a history of great earnings growth are generally safer bets. So you may wish to see this free collection of other companies that have reasonable P/E ratios and have grown earnings strongly.
Valuation is complex, but we're here to simplify it.
Discover if TPG might be undervalued or overvalued with our detailed analysis, featuring fair value estimates, potential risks, dividends, insider trades, and its financial condition.
Access Free AnalysisHave feedback on this article? Concerned about the content? Get in touch with us directly. Alternatively, email editorial-team (at) simplywallst.com.
This article by Simply Wall St is general in nature. We provide commentary based on historical data and analyst forecasts only using an unbiased methodology and our articles are not intended to be financial advice. It does not constitute a recommendation to buy or sell any stock, and does not take account of your objectives, or your financial situation. We aim to bring you long-term focused analysis driven by fundamental data. Note that our analysis may not factor in the latest price-sensitive company announcements or qualitative material. Simply Wall St has no position in any stocks mentioned.
About NasdaqGS:TPG
TPG
Operates as an alternative asset manager in the United States and internationally.
Adequate balance sheet with moderate growth potential.
Similar Companies
Market Insights

Advertisement
Community Narratives
The Next Phase of Energy Storage: How NeoVolta Is Tackling America’s Power Crunch
Fair Value US$7.50|35.2% undervalued
MA
Community Contributor
Why EnSilica is Worth Possibly 13x its Current Price
Fair Value UK£5.00|90.0% undervalued
DO
Community Contributor
M&A Activity, Industry Diversification & A Defense Contract Monopoly Will Push BWXT For Healthy Long-Term Growth
Fair Value US$220.00|15.6% undervalued
CL
Community Contributor
A case for Cassiar Gold Corp (TSXV: GLDC) to reach CAD$8-10 before 2030 (X30-37)
Fair Value CA$10.00|97.1% undervalued
AG
Community Contributor