Advertisement
- United States
- /
- Capital Markets
- /
- NasdaqGS:STEP
StepStone Group’s 5.7% Slide Sparks Debate on Real Value Amid Strong Long-Term Gains

Simply Wall St
Reviewed by Bailey Pemberton
Thinking about what to do with StepStone Group stock right now? You are hardly alone. Whether you have been following it for years or just started watching the asset management world, StepStone Group has likely caught your eye with some very striking numbers. Even after sliding 3.4% over the past week and 5.7% in the last month, StepStone is still up a robust 7.5% year-to-date, echoing the sustained strength it has built over several years. If you happened to get in three or five years ago, you have seen stunning long-term returns: 142.9% and 179.6%, respectively. Those are the kinds of figures that turn casual observation into serious research.
Of course, this impressive momentum has not come from nowhere. Recent industry headlines, such as the growing institutional enthusiasm for alternative asset managers and StepStone’s ongoing expansion into new private markets, have strengthened the company’s story and sparked fresh interest in its risk profile. Investors have started looking more closely at whether the stock now trades above or below fair value; you can see that changing perception reflected in these short-term price moves.
Right now, StepStone Group scores a 2 out of 6 on our valuation checks, suggesting the stock is currently undervalued in two major ways, but potentially stretched elsewhere. That headline number only scratches the surface, however. Let’s dig into what each valuation method says, and as a hint, there is an even more insightful way to frame StepStone Group’s real worth that we will get to by the end of this article.
StepStone Group scores just 2/6 on our valuation checks. See what other red flags we found in the full valuation breakdown.
Approach 1: StepStone Group Excess Returns Analysis
The Excess Returns valuation model provides a focused look at how effectively StepStone Group turns shareholders' equity into profits above its cost of capital. In simple terms, it measures whether the company is earning a return on its investments that meaningfully exceeds what investors demand as compensation for risk.
Key figures for StepStone Group are instructive. Its Book Value stands at $1.96 per share, with a Stable Earnings Per Share of $0.99, based on the median return on equity from the past five years. The Cost of Equity is $1.16 per share, which means the company is currently generating an Excess Return of $-0.17 per share. For context, the average Return on Equity over the recent period is 8.33%, and the Stable Book Value (again, a five-year median) is $11.89 per share.
This model estimates StepStone Group’s intrinsic value at $9.34 per share. Comparing this to the current share price reveals that the stock is trading at a 575.0% premium to its fair value, suggesting considerable overvaluation at present levels.
Result: OVERVALUED
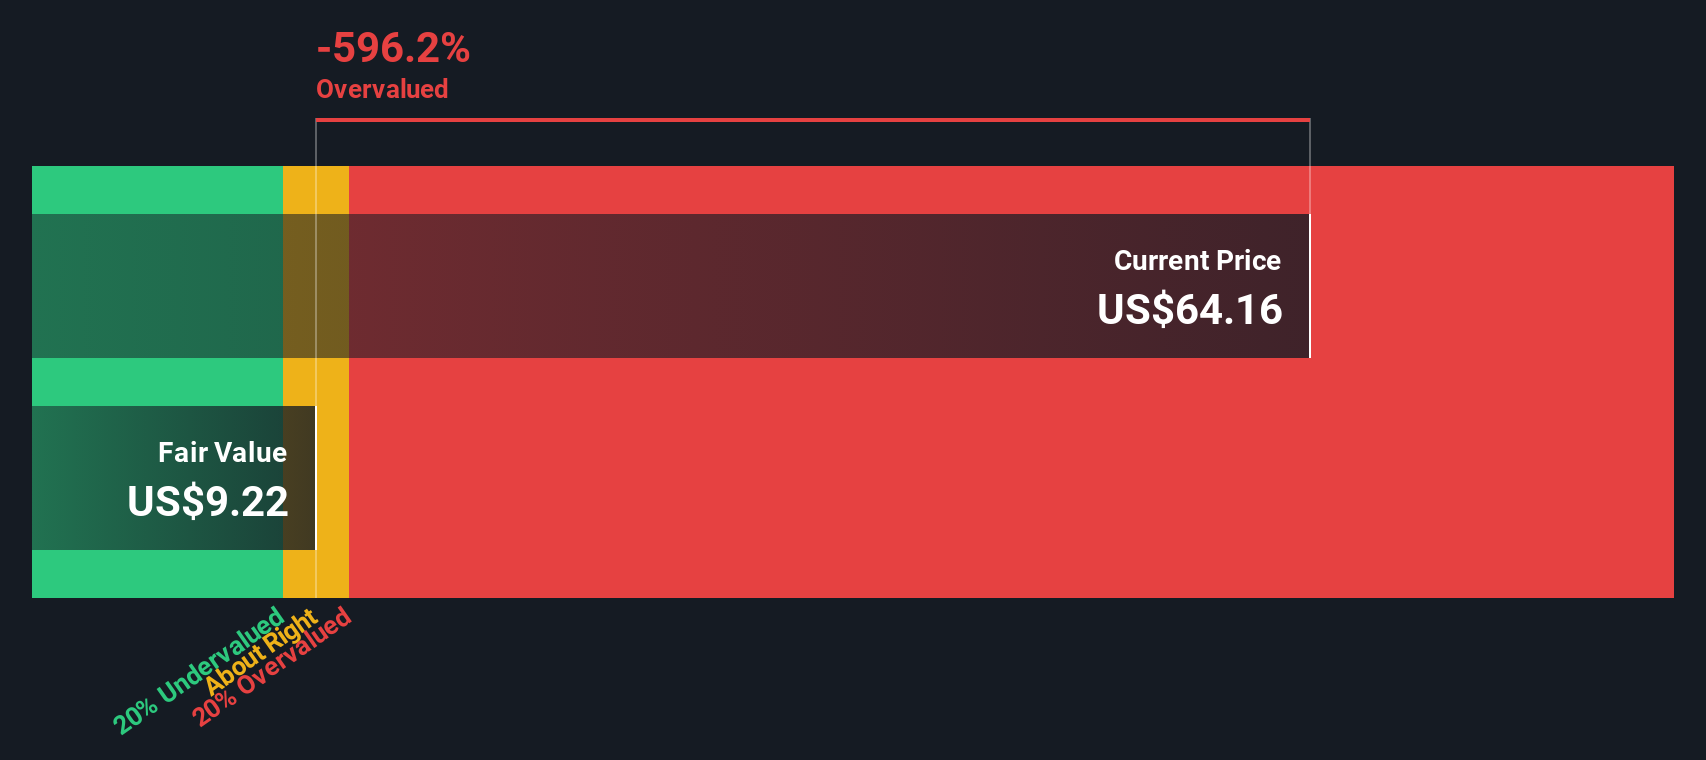
Our Excess Returns analysis suggests StepStone Group may be overvalued by 575.0%. Find undervalued stocks or create your own screener to find better value opportunities.
Approach 2: StepStone Group Price vs Sales
For profitable companies in the asset management sector, the Price-to-Sales (P/S) ratio is a widely used valuation metric because it relates a company's market capitalization to its total sales, providing a useful baseline for comparison where earnings can be volatile or temporarily suppressed. The P/S ratio is particularly relevant when profit margins are fluctuating or when a business prioritizes top-line growth, as is often the case with expanding firms like StepStone Group.
Growth prospects and risk profile are two major factors in setting any "normal" or "fair" multiple for a stock. Higher growth expectations or lower risk generally support a premium P/S ratio, while lower growth or higher operational risk typically justify a discount. This makes context crucial when interpreting valuation multiples.
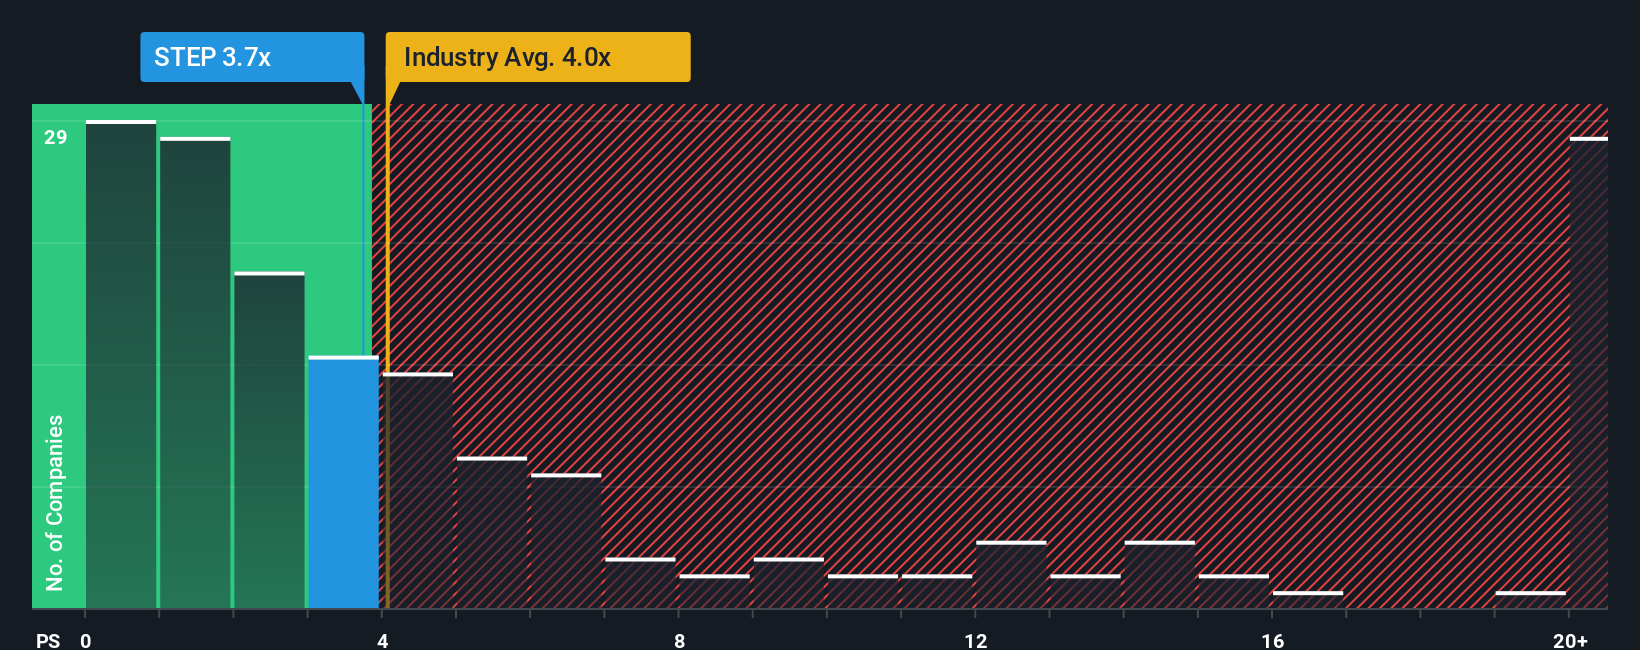
StepStone Group currently trades at a P/S ratio of 3.66x. This is below the Capital Markets industry average of 4.06x and also lower than the peer group average of 5.66x. Simply Wall St’s Fair Ratio metric, designed to set a company-specific target multiple based on factors like revenue growth, profit margins, risks, market cap, and industry dynamics, suggests that a ratio of 1.59x would be appropriate for StepStone Group. The Fair Ratio is preferable to simple peer or industry comparisons because it accounts for the company’s fundamental characteristics rather than relying solely on external benchmarks, allowing for a much more tailored and realistic view of value.
Comparing the actual P/S ratio to the Fair Ratio, StepStone Group appears to be trading at a meaningful premium based on this methodology.
Result: OVERVALUED
PS ratios tell one story, but what if the real opportunity lies elsewhere? Discover companies where insiders are betting big on explosive growth.
Upgrade Your Decision Making: Choose your StepStone Group Narrative
Earlier, we mentioned there is an even better way to understand valuation, so let’s introduce you to Narratives. A Narrative is simply the story investors use to explain a company’s potential, blending their expectations for fair value, future revenue, earnings, and margins, all in one clear view. Rather than just relying on ratios and models, Narratives connect what’s happening inside the business, from leadership changes to industry shifts, directly to a financial forecast and a fair valuation.
Narratives are an accessible and intuitive tool, featured on Simply Wall St’s Community page, where millions of investors share and compare their stories for companies like StepStone Group. By linking the company’s big picture to financial outcomes, Narratives show how your perspective translates into a fair value. This makes it much faster to decide whether the current market price presents a buying or selling opportunity. Because Narratives automatically update with the latest news or earnings results, they stay relevant as the story evolves.
For instance, one investor’s Narrative for StepStone Group might assume rapid expansion and a fair value of $60, while another’s more cautious outlook could land on just $24. This demonstrates how multiple viewpoints coexist and offer fresh insights for smarter investing.
Do you think there's more to the story for StepStone Group? Create your own Narrative to let the Community know!
This article by Simply Wall St is general in nature. We provide commentary based on historical data and analyst forecasts only using an unbiased methodology and our articles are not intended to be financial advice. It does not constitute a recommendation to buy or sell any stock, and does not take account of your objectives, or your financial situation. We aim to bring you long-term focused analysis driven by fundamental data. Note that our analysis may not factor in the latest price-sensitive company announcements or qualitative material. Simply Wall St has no position in any stocks mentioned.
New: Manage All Your Stock Portfolios in One Place
We've created the ultimate portfolio companion for stock investors, and it's free.
• Connect an unlimited number of Portfolios and see your total in one currency
• Be alerted to new Warning Signs or Risks via email or mobile
• Track the Fair Value of your stocks
Have feedback on this article? Concerned about the content? Get in touch with us directly. Alternatively, email editorial-team@simplywallst.com
About NasdaqGS:STEP
StepStone Group
A private equity and venture capital firm specializing in primary, direct, fund of funds, secondary direct, and secondary indirect investments.
Adequate balance sheet and slightly overvalued.
Similar Companies
Market Insights

Advertisement
Community Narratives
Finding The True Value Of A Logistics Powerhouse
Fair Value US$95.21|8.5% undervalued
NV
Community Contributor
Paradigm Biopharmaceuticals Will Lead Osteoarthritis Treatment with Zilosul's FDA Success
Fair Value AU$5.50|91.8% undervalued
AM
Community Contributor
Barrick Mining (ABX:CA): A Gold Hedge against a U.S. Shutdown
Fair Value CA$60.00|26.5% undervalued
GM
Community Contributor