Advertisement
- United States
- /
- Diversified Financial
- /
- NasdaqCM:MBIN
Merchants Bancorp (MBIN): Assessing Valuation Following Mixed Q2 Results and Raised Analyst Price Targets

Simply Wall St
Reviewed by Kshitija Bhandaru
Merchants Bancorp (MBIN) recently reported its second-quarter results, surprising the market with revenue that topped expectations due to its emphasis on low-risk, government-backed lending. However, earnings per share and net interest income fell short.
See our latest analysis for Merchants Bancorp.
Following Merchants Bancorp’s stronger-than-expected Q2 revenue report, the share price slipped about 8% as investors digested the mixed earnings picture and compared it to peers. Looking back, the company’s one-year total shareholder return is nearly flat, trailing its longer-term three- and five-year total returns. This signals that momentum has cooled lately as expectations recalibrate.
If you’re watching how regional banks are weathering this environment, now is a prime moment to branch out and discover fast growing stocks with high insider ownership
With the stock lagging its sector despite fresh analyst optimism and a sizable discount to price targets, investors must now weigh whether Merchants Bancorp is undervalued or if the market already reflects its future prospects.
Price-to-Earnings of 7.1x: Is it justified?
Merchants Bancorp’s shares are trading at a price-to-earnings ratio of 7.1x based on the latest closing price of $32.17. This positions the stock as meaningfully undervalued compared to its sector and peer benchmarks.
The price-to-earnings (P/E) ratio reflects how much investors are willing to pay for each dollar of earnings. For banking and diversified financial companies, a lower P/E often signals the market is skeptical about future growth or sees higher risk. In Merchants Bancorp’s case, its current P/E suggests the market may be discounting its long-term strengths despite a record of consistent profitability.
This P/E is well below both the US Diversified Financial industry average of 16.5x and its peer group average of 18.5x, highlighting the relative value opportunity. When compared to its estimated fair P/E ratio of 14.4x, the case for a market re-rating appears stronger.
Explore the SWS fair ratio for Merchants Bancorp
Result: Price-to-Earnings of 7.1x (UNDERVALUED)
However, ongoing weak one-year returns and recent declines could signal persistent investor caution if growth fails to accelerate or if sector headwinds worsen.
Find out about the key risks to this Merchants Bancorp narrative.
Another View: What Does the DCF Model Say?
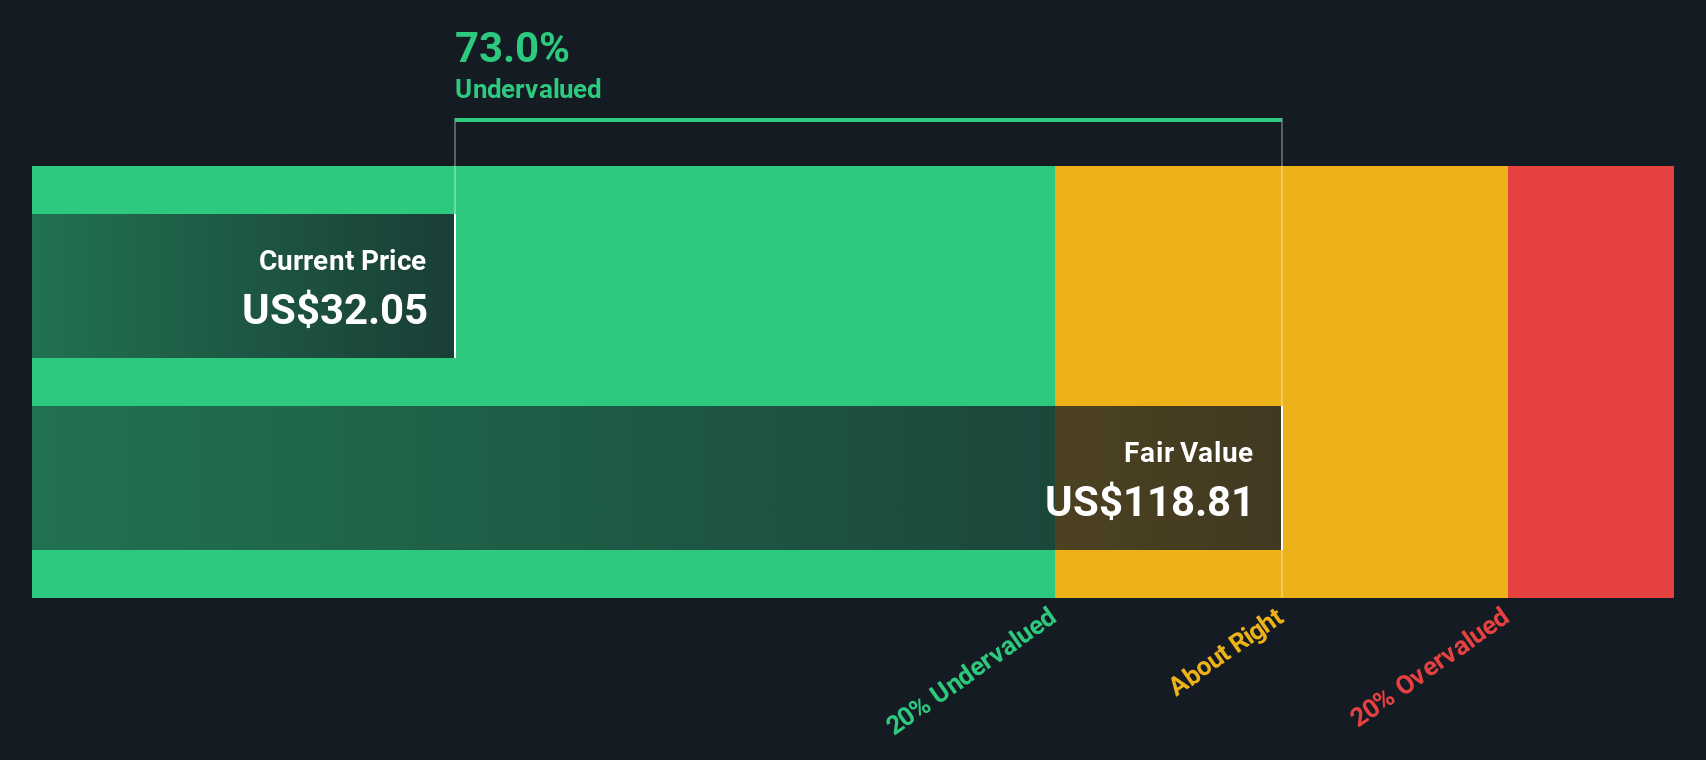
The SWS DCF model suggests Merchants Bancorp is trading at a steep 73% discount to its estimated fair value of $119.85. This discount appears even deeper than what the earnings multiple alone would imply. If this discounted cash flow result is accurate, are investors missing a major long-term opportunity?
Look into how the SWS DCF model arrives at its fair value.
Simply Wall St performs a discounted cash flow (DCF) on every stock in the world every day (check out Merchants Bancorp for example). We show the entire calculation in full. You can track the result in your watchlist or portfolio and be alerted when this changes, or use our stock screener to discover undervalued stocks based on their cash flows. If you save a screener we even alert you when new companies match - so you never miss a potential opportunity.
Build Your Own Merchants Bancorp Narrative
If you see the story differently or want to dive deeper, it’s easy to shape your own view using the latest data and tools in just a few minutes. Do it your way
A great starting point for your Merchants Bancorp research is our analysis highlighting 4 key rewards and 2 important warning signs that could impact your investment decision.
Ready for More Winning Stock Ideas?
Smart investors never settle for just one market story. Uncover your next opportunity today with carefully curated lists designed to fit your unique goals and interests.
- Capture reliable income streams when you assess the top companies offering yields above 3% through these 19 dividend stocks with yields > 3%.
- Spot fast movers shaking up digital currency and blockchain by using these 78 cryptocurrency and blockchain stocks for the most promising disruptive players.
- Capitalize on untapped bargains by reviewing these 896 undervalued stocks based on cash flows to see which stocks the market may be mispricing right now.
This article by Simply Wall St is general in nature. We provide commentary based on historical data and analyst forecasts only using an unbiased methodology and our articles are not intended to be financial advice. It does not constitute a recommendation to buy or sell any stock, and does not take account of your objectives, or your financial situation. We aim to bring you long-term focused analysis driven by fundamental data. Note that our analysis may not factor in the latest price-sensitive company announcements or qualitative material. Simply Wall St has no position in any stocks mentioned.
New: Manage All Your Stock Portfolios in One Place
We've created the ultimate portfolio companion for stock investors, and it's free.
• Connect an unlimited number of Portfolios and see your total in one currency
• Be alerted to new Warning Signs or Risks via email or mobile
• Track the Fair Value of your stocks
Have feedback on this article? Concerned about the content? Get in touch with us directly. Alternatively, email editorial-team@simplywallst.com
About NasdaqCM:MBIN
Merchants Bancorp
Operates as the diversified bank holding company in the United States.
Very undervalued with adequate balance sheet.
Market Insights

Advertisement
Community Narratives
The Next Phase of Energy Storage: How NeoVolta Is Tackling America’s Power Crunch
Fair Value US$7.50|35.1% undervalued
MA
Community Contributor
Why EnSilica is Worth Possibly 13x its Current Price
Fair Value UK£5.00|89.8% undervalued
DO
Community Contributor
M&A Activity, Industry Diversification & A Defense Contract Monopoly Will Push BWXT For Healthy Long-Term Growth
Fair Value US$220.00|15.2% undervalued
CL
Community Contributor
A case for Cassiar Gold Corp (TSXV: GLDC) to reach CAD$8-10 before 2030 (X30-37)
Fair Value CA$10.00|96.0% undervalued
AG
Community Contributor