Advertisement
- United States
- /
- Capital Markets
- /
- NasdaqGS:HOOD
Is Robinhood a Smart Bet After Its 210% Rally and Industry Buzz?

Simply Wall St
Reviewed by Bailey Pemberton
- Curious whether Robinhood Markets is still a bargain after its dramatic rally? You are not alone, especially with so many investors looking for the next big opportunity.
- Robinhood’s stock price has jumped an astonishing 210.6% year-to-date and 279.0% over the past 12 months, even with short-term dips of -6.0% in the last week and -5.7% over the last month.
- Recent headlines have centered around renewed retail trading enthusiasm and shifts in regulatory discussions, giving investors reasons to reconsider Robinhood’s role in a more volatile market. News of industry peers adapting their business models has also shined a spotlight on Robinhood’s growth prospects and unique challenges.
- On our valuation scorecard, Robinhood rates a 1 out of 6 for undervaluation, meaning it is currently undervalued in only one check. Next, we will break down what that means by looking at different valuation approaches and why sometimes there is an even smarter way to judge a company’s true worth. Stay tuned to the end for that perspective.
Robinhood Markets scores just 1/6 on our valuation checks. See what other red flags we found in the full valuation breakdown.
Approach 1: Robinhood Markets Excess Returns Analysis
The Excess Returns Model offers a way to judge a company by how much value it creates for shareholders above the baseline cost of equity. This method looks at Robinhood’s ability to generate profits from its invested capital, focusing on how much return exceeds the minimum expected by investors.
For Robinhood Markets, the key metrics include a Book Value of $9.53 per share and a Stable Earnings Per Share (EPS) of $2.87, based on estimates from nine analysts. The average Return on Equity stands at an impressive 22.82%, highlighting the company’s strong profitability compared to peers. With a Cost of Equity at $1.06 per share, Robinhood’s Excess Return comes to $1.81 per share. This demonstrates the company generates returns well above the minimum rate required by investors. The Stable Book Value Estimate is $12.57 per share, as projected by five analysts.
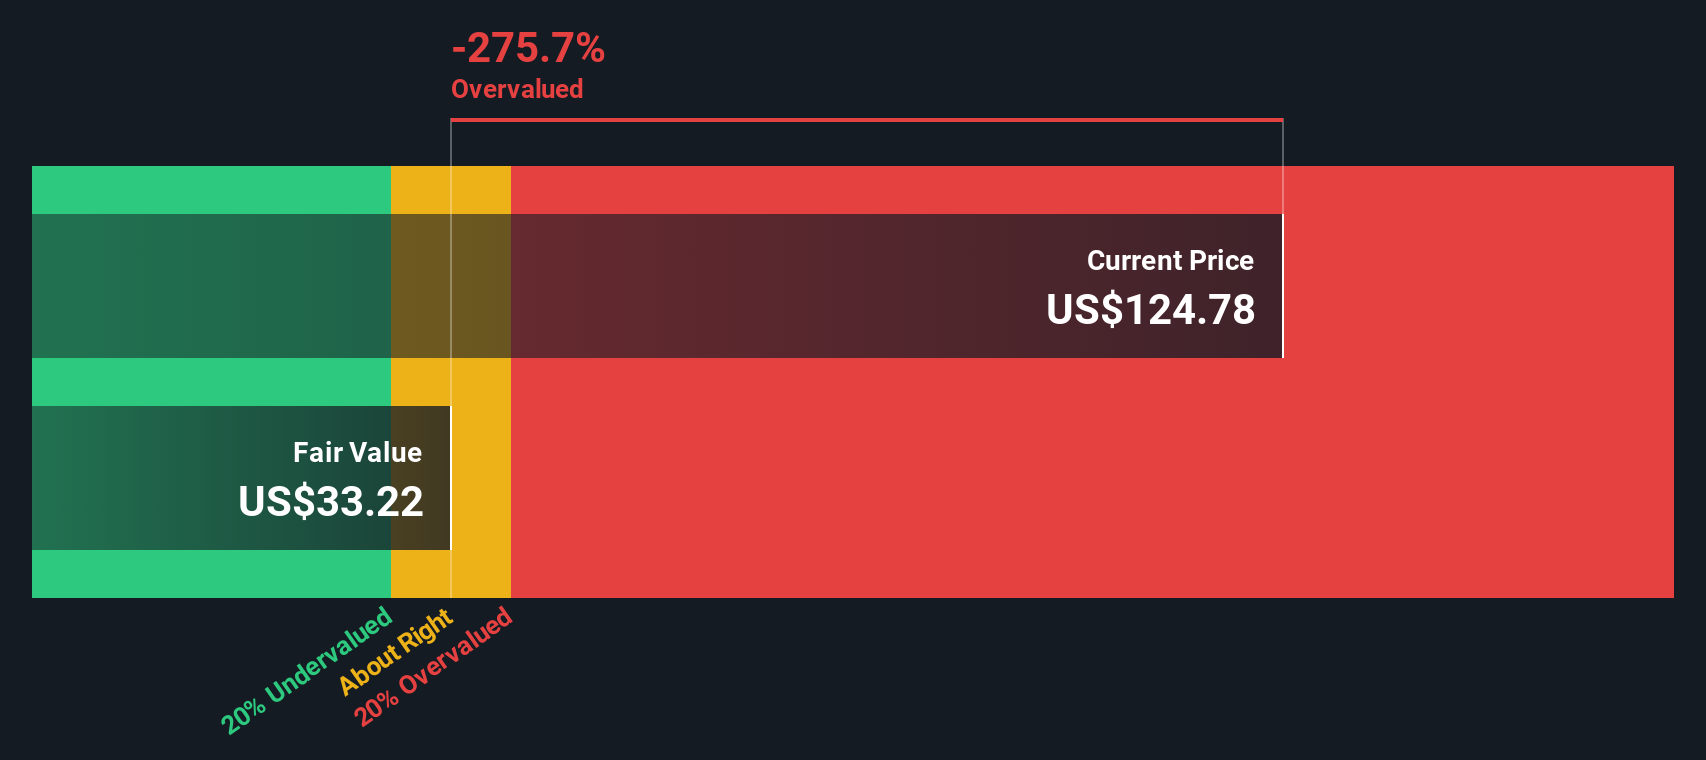
Despite this strong performance, the Excess Returns Model results in an intrinsic share value that is much lower than the current market price. According to this model, Robinhood’s stock is approximately 159.2% overvalued at recent levels, signaling that investors are paying a significant premium above what the company’s fundamentals suggest.
Result: OVERVALUED
Our Excess Returns analysis suggests Robinhood Markets may be overvalued by 159.2%. Discover 885 undervalued stocks or create your own screener to find better value opportunities.
Approach 2: Robinhood Markets Price vs Earnings
The Price-to-Earnings (PE) ratio is widely regarded as a suitable metric for assessing the valuation of profitable companies because it directly relates a company’s share price to its earnings per share. This offers a snapshot of how much investors are willing to pay for each dollar of profit. The metric is particularly relevant for businesses like Robinhood Markets that have moved into profitability and are expected to continue growing their bottom line.
Growth expectations and risk profiles both play critical roles in setting what counts as a “normal” or “fair” PE ratio for a stock. Typically, higher growth or lower perceived risk justifies a higher PE ratio, as investors anticipate stronger future earnings. On the other hand, slower growth or greater uncertainty tends to cap how much the market is willing to pay for current profits, resulting in a lower multiple.
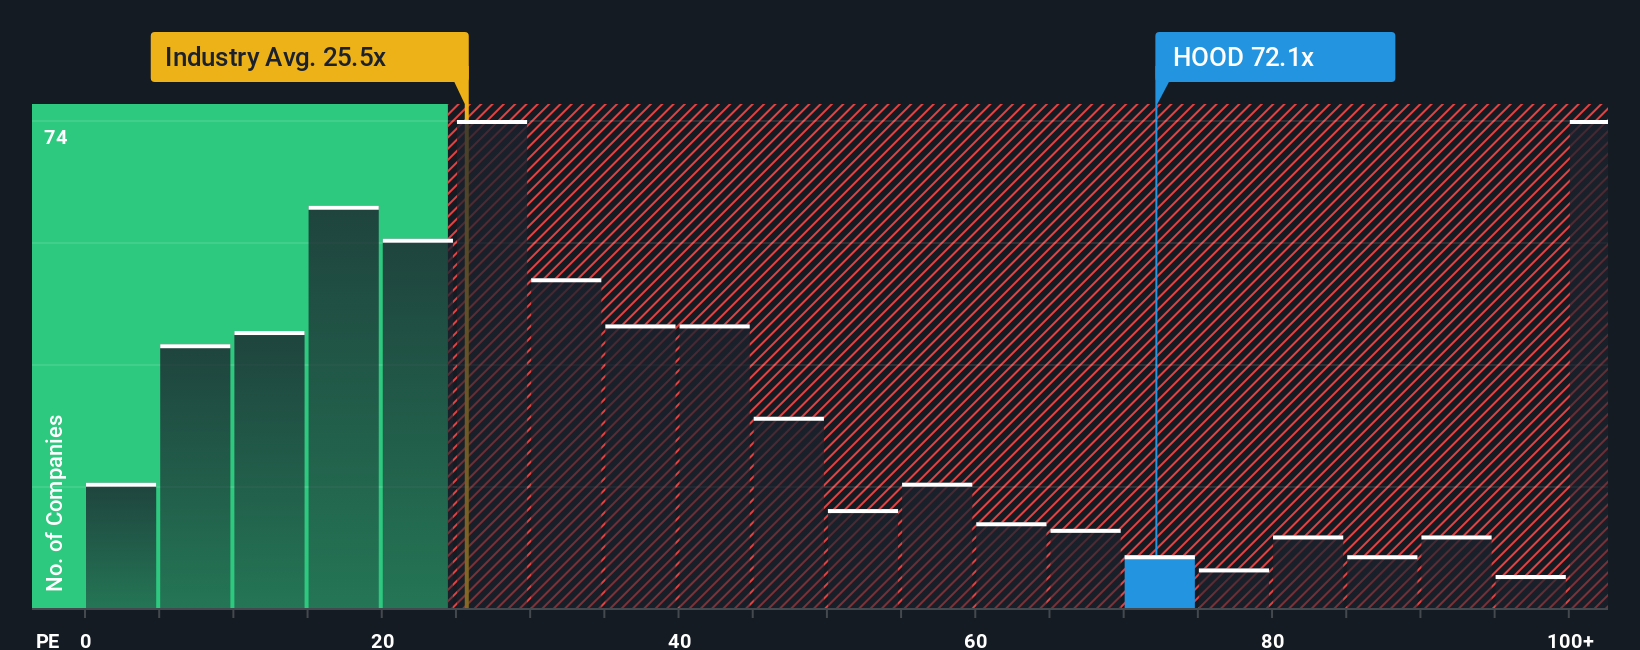
Currently, Robinhood Markets trades at a PE ratio of 50.2x. For comparison, the average PE ratio across the Capital Markets industry is 24.6x, and Robinhood’s peer group averages around 21.5x. Simply Wall St’s proprietary “Fair Ratio” for Robinhood, which accounts for its expected earnings growth, profit margins, risk profile, industry position, and market cap, is much lower at 24.4x. This personalized benchmark goes a step beyond raw peer or industry averages by tailoring the fair valuation multiple to the company’s unique strengths and risks.
Comparing Robinhood’s actual PE ratio (50.2x) with its Fair Ratio (24.4x) suggests that the stock is priced significantly above what would be considered reasonable, even allowing for its potential and growth story.
Result: OVERVALUED
PE ratios tell one story, but what if the real opportunity lies elsewhere? Discover 1411 companies where insiders are betting big on explosive growth.
Upgrade Your Decision Making: Choose your Robinhood Markets Narrative
Earlier we mentioned that there is an even better way to understand valuation, so let us introduce you to Narratives. A Narrative is the story you build around a company: your view of its future potential, risks, and opportunities that links directly to your own forecast for revenue, earnings, margins, and ultimately, fair value.
Rather than relying on just a single set of numbers, Narratives bring a company’s journey to life by combining your unique perspective with dynamic financial models. On Simply Wall St's Community page, creating and comparing Narratives is simple and accessible, allowing millions of investors to connect their outlook to actual fair value calculations and see exactly where they agree or differ with others.
Narratives help clarify whether now is the right time to buy or sell by letting you compare each user’s fair value to the latest share price; plus, they automatically update whenever fresh news or earnings reports arrive.
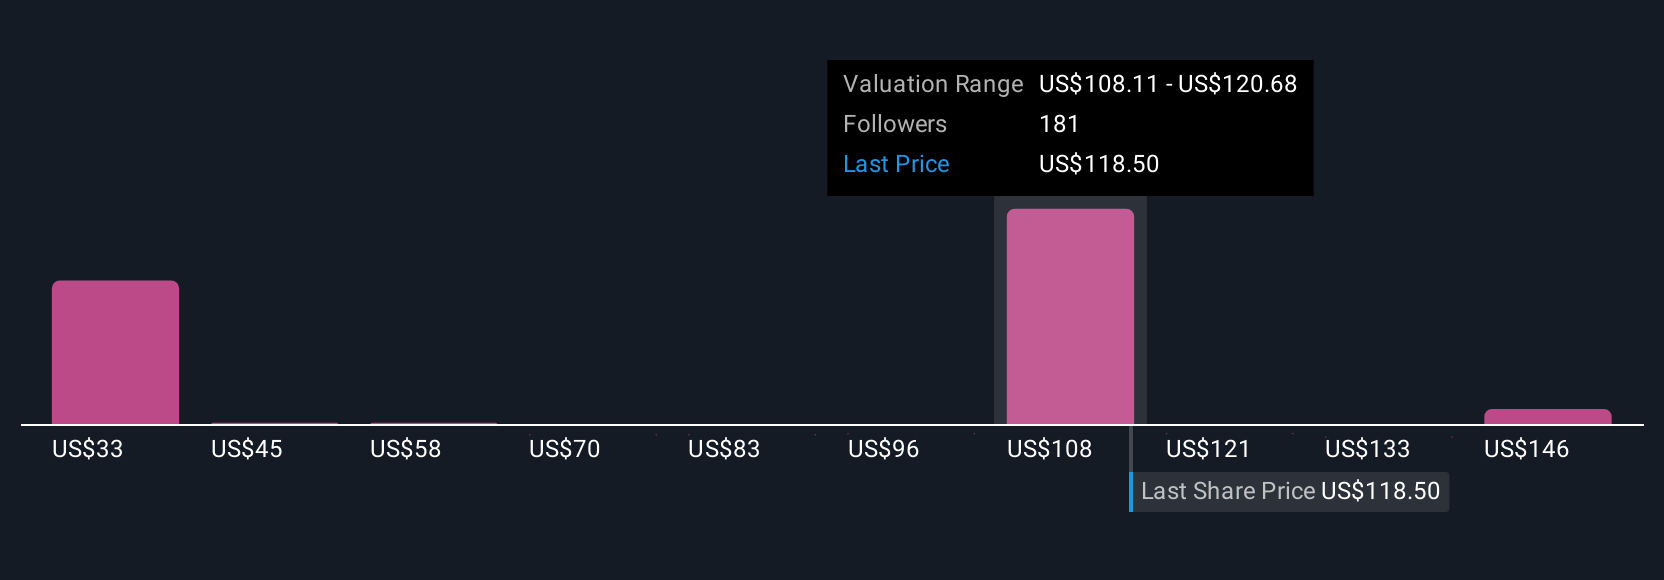
For example, Robinhood’s most bullish Narrative, driven by rapid global expansion and tech innovation, values the stock at $160 per share. In contrast, the most bearish Narrative, focused on margin compression and changing customer trends, puts fair value as low as $50. This variation reminds us that every investor’s story can reveal a distinct opportunity or risk.
Do you think there's more to the story for Robinhood Markets? Head over to our Community to see what others are saying!
This article by Simply Wall St is general in nature. We provide commentary based on historical data and analyst forecasts only using an unbiased methodology and our articles are not intended to be financial advice. It does not constitute a recommendation to buy or sell any stock, and does not take account of your objectives, or your financial situation. We aim to bring you long-term focused analysis driven by fundamental data. Note that our analysis may not factor in the latest price-sensitive company announcements or qualitative material. Simply Wall St has no position in any stocks mentioned.
New: AI Stock Screener & Alerts
Our new AI Stock Screener scans the market every day to uncover opportunities.
• Dividend Powerhouses (3%+ Yield)
• Undervalued Small Caps with Insider Buying
• High growth Tech and AI Companies
Or build your own from over 50 metrics.
Have feedback on this article? Concerned about the content? Get in touch with us directly. Alternatively, email editorial-team@simplywallst.com
About NasdaqGS:HOOD
Robinhood Markets
Operates financial services platform in the United States.
Proven track record with moderate growth potential.
Similar Companies
Market Insights

Advertisement
Community Narratives
MINISO's fair value is projected at 26.69 with an anticipated PE ratio shift of 20x
Fair Value US$24.03|11.0% undervalued
BE
Community Contributor
Procter & Gamble: A Dividend Giant Facing Slowing Growth
Fair Value US$119.81|23.3% overvalued
AN
Community Contributor
Eli Lilly's Future Growth Driven by Tirzepatide and Favorable Market Conditions
Fair Value US$1.19k|13.8% undervalued
EA
Community Contributor