Advertisement
- United States
- /
- Capital Markets
- /
- NasdaqCM:FRHC
Freedom Holding (FRHC): Evaluating Valuation After Institutional Position Shifts and Insider Trades

Simply Wall St
Reviewed by Simply Wall St
Freedom Holding (NasdaqCM:FRHC) is drawing attention after recent filings revealed that major institutional investors, including BlackRock and State Street, have boosted their holdings. At the same time, firms such as Goldman Sachs have trimmed their positions.
See our latest analysis for Freedom Holding.
This period of reshuffling among major shareholders and active insider trades comes as Freedom Holding's shares have slipped nearly 10% over the past month but are still up a solid 17.7% year-to-date. Importantly, momentum remains strong for long-term holders, with total shareholder return reaching more than 41% over the past year and an impressive 474% over five years. All of this suggests that, despite recent volatility, investor enthusiasm for the company’s growth story remains resilient.
If you’re curious what other market standouts have been catching institutional attention lately, this is a great time to broaden your search and discover fast growing stocks with high insider ownership
Yet with insiders trading and the biggest funds shuffling their stakes, the crucial question is whether the market has already fully priced in Freedom Holding’s growth or if investors are looking at a genuine buying opportunity.
Price-to-Earnings of 119x: Is it justified?
Freedom Holding trades at a price-to-earnings (P/E) ratio of 119, which stands out as extremely high given the last close of $156.77. This signals a rich valuation compared to both industry and peers.
The P/E ratio measures how much investors are willing to pay today for each dollar of earnings generated by the company. In the capital markets sector, this ratio is often used to gauge whether a stock is expensive or cheap compared to its profit generation capability. Such a high P/E might reflect expectations of future growth or unique business prospects. However, it can also raise questions about sustainability if earnings do not accelerate.
Freedom Holding's P/E of 119 is much higher than the US Capital Markets industry average of 26.6, and also exceeds the peer average of 18.5. This suggests that the market is assigning a premium that could be difficult to justify unless the company delivers exceptionally strong future results. If the fair ratio were available, it would offer another reference point for where the valuation could trend.
See what the numbers say about this price — find out in our valuation breakdown.
Result: Price-to-Earnings of 119 (OVERVALUED)
However, risks remain, such as lackluster earnings growth or a sharp change in investor sentiment. Either of these could challenge the current valuation.
Find out about the key risks to this Freedom Holding narrative.
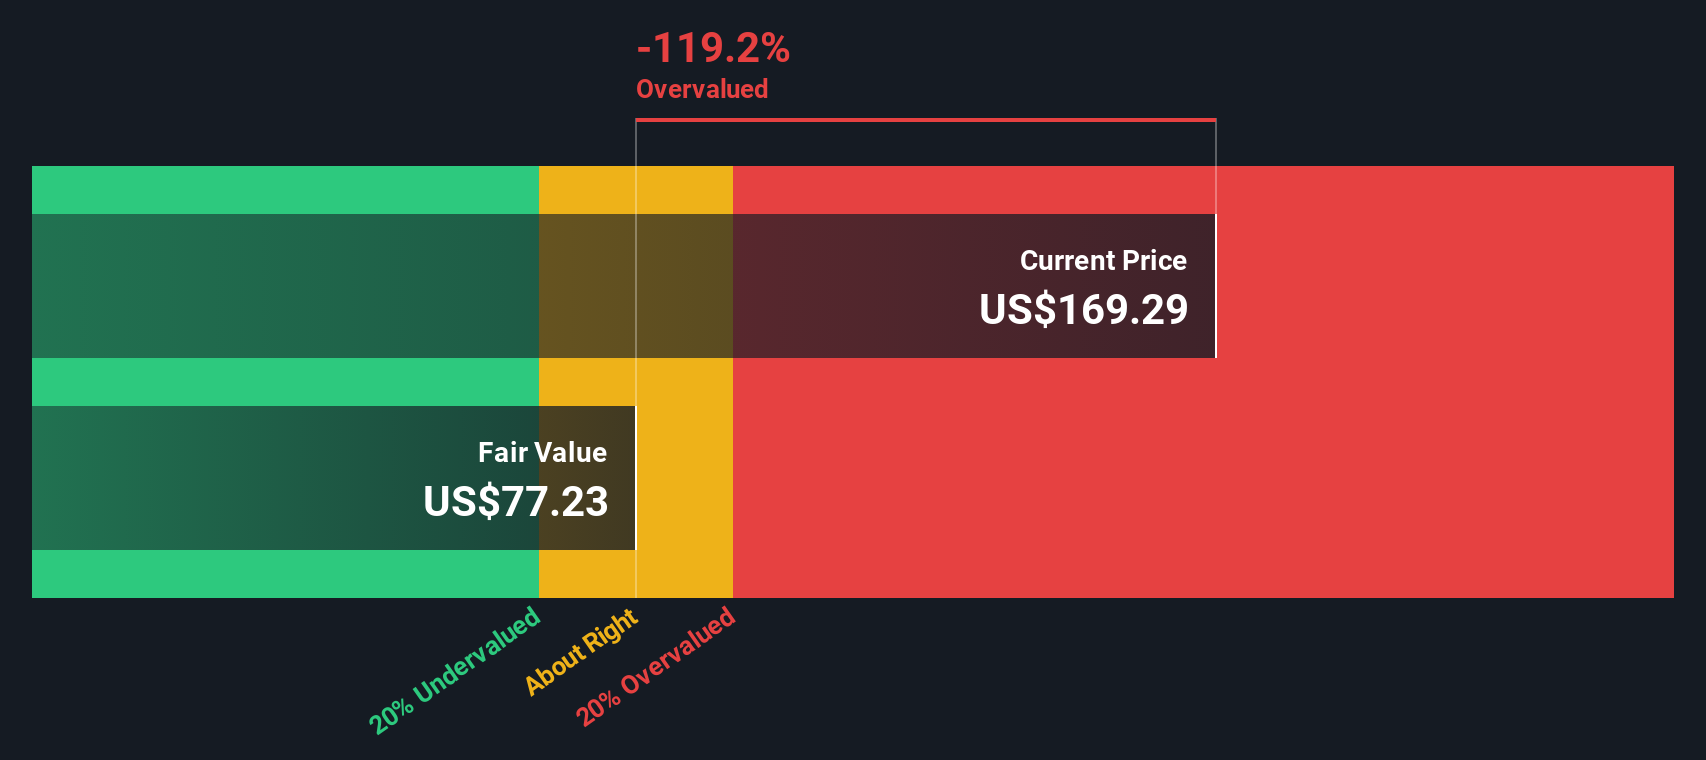
Another View: SWS DCF Model Suggests Overvaluation
Looking at Freedom Holding through the lens of our SWS discounted cash flow (DCF) model gives a very different signal. The DCF suggests the current share price of $156.77 is well above its estimated fair value, which sits near $77.18. This divergence calls the high market premium into question, sparking debate about whether optimism is outpacing fundamentals.
Look into how the SWS DCF model arrives at its fair value.
Simply Wall St performs a discounted cash flow (DCF) on every stock in the world every day (check out Freedom Holding for example). We show the entire calculation in full. You can track the result in your watchlist or portfolio and be alerted when this changes, or use our stock screener to discover undervalued stocks based on their cash flows. If you save a screener we even alert you when new companies match - so you never miss a potential opportunity.
Build Your Own Freedom Holding Narrative
If you’re interested in drawing your own conclusions or want to dig deeper into the numbers, you can easily craft your own take in just a few short minutes, starting with Do it your way
A great starting point for your Freedom Holding research is our analysis highlighting 2 important warning signs that could impact your investment decision.
Ready for More Investment Ideas?
Don't limit yourself to just one opportunity. Supercharge your investing journey by scanning breakthrough ideas and unique sectors with just a few clicks using the Simply Wall Street Screener.
- Unlock steady income potential when you check out these 19 dividend stocks with yields > 3% for robust yields and consistent cash flow, supporting reliable returns.
- Tap fresh growth possibilities by reviewing these 27 AI penny stocks as artificial intelligence continues to transform industries and generate new winners.
- Spot hidden gems before the crowd by targeting these 875 undervalued stocks based on cash flows with strong fundamentals and attractive valuations.
This article by Simply Wall St is general in nature. We provide commentary based on historical data and analyst forecasts only using an unbiased methodology and our articles are not intended to be financial advice. It does not constitute a recommendation to buy or sell any stock, and does not take account of your objectives, or your financial situation. We aim to bring you long-term focused analysis driven by fundamental data. Note that our analysis may not factor in the latest price-sensitive company announcements or qualitative material. Simply Wall St has no position in any stocks mentioned.
New: AI Stock Screener & Alerts
Our new AI Stock Screener scans the market every day to uncover opportunities.
• Dividend Powerhouses (3%+ Yield)
• Undervalued Small Caps with Insider Buying
• High growth Tech and AI Companies
Or build your own from over 50 metrics.
Have feedback on this article? Concerned about the content? Get in touch with us directly. Alternatively, email editorial-team@simplywallst.com
About NasdaqCM:FRHC
Freedom Holding
Through its subsidiaries, provides securities brokerage, securities dealing, market making, investment research, investment counseling, retail and commercial banking, and insurance products.
Questionable track record with imperfect balance sheet.
Similar Companies
Market Insights

Advertisement
Community Narratives
Finding The True Value Of A Logistics Powerhouse
Fair Value US$95.21|6.3% undervalued
NV
Community Contributor
Paradigm Biopharmaceuticals Will Lead Osteoarthritis Treatment with Zilosul's FDA Success
Fair Value AU$5.50|91.9% undervalued
AM
Community Contributor
Barrick Mining (ABX:CA): A Gold Hedge against a U.S. Shutdown
Fair Value CA$60.00|25.8% undervalued
GM
Community Contributor