Advertisement
- United States
- /
- Consumer Finance
- /
- NasdaqGS:FIGR
Figure Technology Solutions (FIGR): Assessing Valuation After Strong Q3 Earnings Growth

Simply Wall St
Reviewed by Simply Wall St
Figure Technology Solutions (FIGR) just reported its third-quarter earnings, and the numbers caught investors’ attention. Both revenue and net income jumped sharply compared to last year, which signals meaningful business momentum.
See our latest analysis for Figure Technology Solutions.
Figure Technology Solutions’ share price has surged lately, rallying 16.33% in the last day and 10.07% over the past week, following upbeat earnings and recent conference buzz. With a year-to-date share price return of 29.35%, momentum appears to be building for the stock.
If these market moves have you looking for what else is gaining traction, now could be the perfect time to broaden your search and discover fast growing stocks with high insider ownership
With shares rising and earnings soaring, investors are left weighing the possibilities. Is Figure Technology Solutions still trading below its true worth, or has the market already priced in all the good news and future growth potential?
Price-to-Sales Ratio of 29.1x: Is it justified?
Figure Technology Solutions is trading at a price-to-sales ratio of 29.1x, while the last closing share price stood at $40.24. This valuation metric positions the company at a significant premium compared to both its industry and peer averages.
The price-to-sales (P/S) ratio is a common valuation tool for growth-stage companies, especially in financial technology. It compares a company’s market capitalization to its revenue, helping investors gauge whether growth prospects justify a lofty market price. For Figure Technology Solutions, a high P/S ratio reflects the market’s expectations for extraordinary future revenue growth.
However, the current P/S multiple of 29.1x stands well above the US Consumer Finance industry average of 1.4x and the peer average of 2.5x. This notable difference suggests that investors are pricing in aggressive growth assumptions or unique market positioning for Figure Technology Solutions that peers do not seem to command. If the valuation moves closer to industry norms, it could imply a significant price adjustment in the future.
See what the numbers say about this price — find out in our valuation breakdown.
Result: Price-to-Sales of 29.1x (OVERVALUED)
However, slowing revenue growth or a sudden drop in net income could quickly challenge the optimistic outlook that is reflected in Figure Technology Solutions’ valuation.
Find out about the key risks to this Figure Technology Solutions narrative.
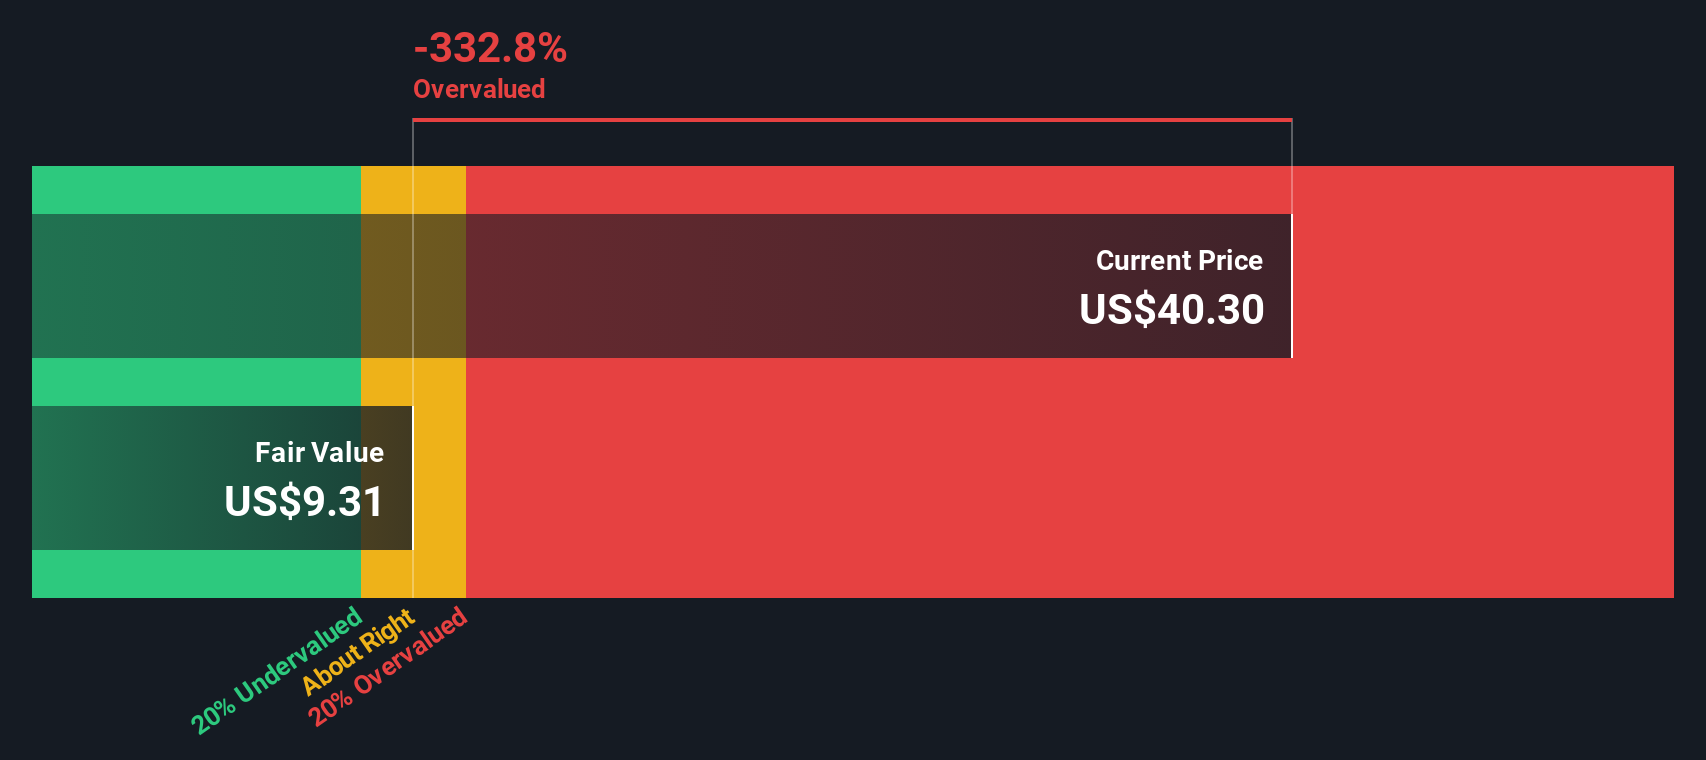
Another View: Discounted Cash Flow Model Signals More Risk
Looking at Figure Technology Solutions through the lens of our DCF model offers a sharply different perspective. According to this approach, the company’s fair value comes in at just $9.23 per share. Meanwhile, the stock trades much higher at $40.24. This points toward the possibility that shares could be significantly overvalued based on anticipated future cash flows.
Look into how the SWS DCF model arrives at its fair value.
Simply Wall St performs a discounted cash flow (DCF) on every stock in the world every day (check out Figure Technology Solutions for example). We show the entire calculation in full. You can track the result in your watchlist or portfolio and be alerted when this changes, or use our stock screener to discover 879 undervalued stocks based on their cash flows. If you save a screener we even alert you when new companies match - so you never miss a potential opportunity.
Build Your Own Figure Technology Solutions Narrative
If you see things differently or want to draw your own conclusions, you can build a custom story from the data in just a few minutes, and Do it your way.
A great starting point for your Figure Technology Solutions research is our analysis highlighting 2 key rewards and 3 important warning signs that could impact your investment decision.
Looking for more investment ideas?
Smart investors never stop at just one opportunity. The Simply Wall Street Screener lets you quickly spot stocks with strong momentum, hidden value, and innovative potential you might otherwise miss.
- Capitalize on strong cash flows and attractive prices by checking out these 879 undervalued stocks based on cash flows that meet strict value benchmarks beyond the obvious big names.
- Future-proof your portfolio by targeting the next breakthroughs with these 25 AI penny stocks harnessing artificial intelligence across industries.
- Steady your returns with reliable income streams. See these 16 dividend stocks with yields > 3% delivering yields above 3%, perfect for income-focused investors.
This article by Simply Wall St is general in nature. We provide commentary based on historical data and analyst forecasts only using an unbiased methodology and our articles are not intended to be financial advice. It does not constitute a recommendation to buy or sell any stock, and does not take account of your objectives, or your financial situation. We aim to bring you long-term focused analysis driven by fundamental data. Note that our analysis may not factor in the latest price-sensitive company announcements or qualitative material. Simply Wall St has no position in any stocks mentioned.
New: AI Stock Screener & Alerts
Our new AI Stock Screener scans the market every day to uncover opportunities.
• Dividend Powerhouses (3%+ Yield)
• Undervalued Small Caps with Insider Buying
• High growth Tech and AI Companies
Or build your own from over 50 metrics.
Have feedback on this article? Concerned about the content? Get in touch with us directly. Alternatively, email editorial-team@simplywallst.com
About NasdaqGS:FIGR
Figure Technology Solutions
Develops and operates a blockchain-based consumer lending platform.
High growth potential with mediocre balance sheet.
Market Insights

Advertisement
Community Narratives
MINISO's fair value is projected at 26.69 with an anticipated PE ratio shift of 20x
Fair Value US$24.03|11.0% undervalued
BE
Community Contributor
Procter & Gamble: A Dividend Giant Facing Slowing Growth
Fair Value US$119.81|23.3% overvalued
AN
Community Contributor
Eli Lilly's Future Growth Driven by Tirzepatide and Favorable Market Conditions
Fair Value US$1.19k|13.8% undervalued
EA
Community Contributor