- United States
- /
- Diversified Financial
- /
- NasdaqGM:CURR
CURRENC Group Inc. (NASDAQ:CURR) Not Doing Enough For Some Investors As Its Shares Slump 32%

CURRENC Group Inc. (NASDAQ:CURR) shareholders won't be pleased to see that the share price has had a very rough month, dropping 32% and undoing the prior period's positive performance. The recent drop completes a disastrous twelve months for shareholders, who are sitting on a 87% loss during that time.
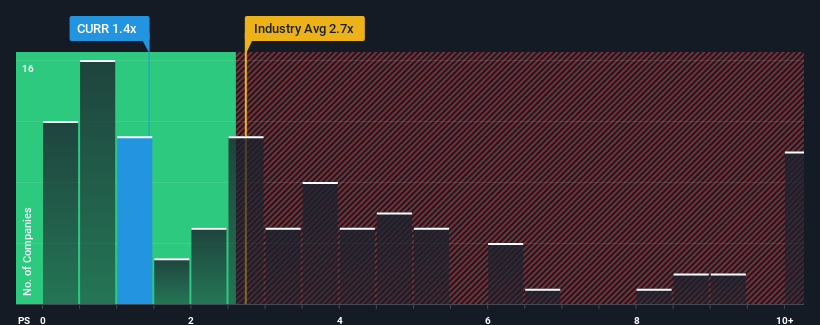
After such a large drop in price, CURRENC Group may be sending bullish signals at the moment with its price-to-sales (or "P/S") ratio of 1.4x, since almost half of all companies in the Diversified Financial industry in the United States have P/S ratios greater than 2.7x and even P/S higher than 5x are not unusual. Although, it's not wise to just take the P/S at face value as there may be an explanation why it's limited.
View our latest analysis for CURRENC Group
What Does CURRENC Group's Recent Performance Look Like?
As an illustration, revenue has deteriorated at CURRENC Group over the last year, which is not ideal at all. It might be that many expect the disappointing revenue performance to continue or accelerate, which has repressed the P/S. Those who are bullish on CURRENC Group will be hoping that this isn't the case so that they can pick up the stock at a lower valuation.
Although there are no analyst estimates available for CURRENC Group, take a look at this free data-rich visualisation to see how the company stacks up on earnings, revenue and cash flow.Do Revenue Forecasts Match The Low P/S Ratio?
The only time you'd be truly comfortable seeing a P/S as low as CURRENC Group's is when the company's growth is on track to lag the industry.
Retrospectively, the last year delivered a frustrating 12% decrease to the company's top line. As a result, revenue from three years ago have also fallen 15% overall. Accordingly, shareholders would have felt downbeat about the medium-term rates of revenue growth.
In contrast to the company, the rest of the industry is expected to grow by 6.2% over the next year, which really puts the company's recent medium-term revenue decline into perspective.
With this in mind, we understand why CURRENC Group's P/S is lower than most of its industry peers. However, we think shrinking revenues are unlikely to lead to a stable P/S over the longer term, which could set up shareholders for future disappointment. Even just maintaining these prices could be difficult to achieve as recent revenue trends are already weighing down the shares.
The Key Takeaway
CURRENC Group's recently weak share price has pulled its P/S back below other Diversified Financial companies. While the price-to-sales ratio shouldn't be the defining factor in whether you buy a stock or not, it's quite a capable barometer of revenue expectations.
It's no surprise that CURRENC Group maintains its low P/S off the back of its sliding revenue over the medium-term. At this stage investors feel the potential for an improvement in revenue isn't great enough to justify a higher P/S ratio. If recent medium-term revenue trends continue, it's hard to see the share price moving strongly in either direction in the near future under these circumstances.
It's always necessary to consider the ever-present spectre of investment risk. We've identified 5 warning signs with CURRENC Group (at least 4 which are a bit concerning), and understanding these should be part of your investment process.
It's important to make sure you look for a great company, not just the first idea you come across. So if growing profitability aligns with your idea of a great company, take a peek at this free list of interesting companies with strong recent earnings growth (and a low P/E).
The New Payments ETF Is Live on NASDAQ:
Money is moving to real-time rails, and a newly listed ETF now gives investors direct exposure. Fast settlement. Institutional custody. Simple access.
Explore how this launch could reshape portfolios
Sponsored ContentNew: AI Stock Screener & Alerts
Our new AI Stock Screener scans the market every day to uncover opportunities.
• Dividend Powerhouses (3%+ Yield)
• Undervalued Small Caps with Insider Buying
• High growth Tech and AI Companies
Or build your own from over 50 metrics.
Have feedback on this article? Concerned about the content? Get in touch with us directly. Alternatively, email editorial-team (at) simplywallst.com.
This article by Simply Wall St is general in nature. We provide commentary based on historical data and analyst forecasts only using an unbiased methodology and our articles are not intended to be financial advice. It does not constitute a recommendation to buy or sell any stock, and does not take account of your objectives, or your financial situation. We aim to bring you long-term focused analysis driven by fundamental data. Note that our analysis may not factor in the latest price-sensitive company announcements or qualitative material. Simply Wall St has no position in any stocks mentioned.
About NasdaqGM:CURR
CURRENC Group
Operates as a fintech company to transform global financial services through artificial intelligence (AI).
Excellent balance sheet with low risk.
Market Insights

Weekly Picks

Early mover in a fast growing industry. Likely to experience share price volatility as they scale


A case for CA$31.80 (undiluted), aka 8,616% upside from CA$0.37 (an 86 bagger!).


Moderation and Stabilisation: HOLD: Fair Price based on a 4-year Cycle is $12.08
Recently Updated Narratives

Airbnb Stock: Platform Growth in a World of Saturation and Scrutiny

Clarivate Stock: When Data Becomes the Backbone of Innovation and Law

Adobe Stock: AI-Fueled ARR Growth Pushes Guidance Higher, But Cost Pressures Loom
Popular Narratives


Crazy Undervalued 42 Baggers Silver Play (Active & Running Mine)


NVDA: Expanding AI Demand Will Drive Major Data Center Investments Through 2026


MicroVision will explode future revenue by 380.37% with a vision towards success
Trending Discussion
