Advertisement
- United States
- /
- Capital Markets
- /
- NasdaqGS:CME
Is CME Group’s Five-Year 120% Rally Justified After Latest Valuation Signals?

Simply Wall St
Reviewed by Bailey Pemberton
Thinking about what to do with CME Group stock? You are not alone. This financial powerhouse has been riding an impressive wave, and there is no shortage of chatter among investors who want to know if the stock is still a buy. Over the past week, CME has notched a 2.4% gain, capping off a 30-day advance of 2.6%. Year to date, the stock is up a healthy 15.5%. If you have held on for the long run, the numbers are even more eye-popping, with a 22.3% return over the past year and a 119.8% rally over five years. Even in a market shaped by shifting risk appetites and ongoing debates about the economy, CME has found a way to remain in the spotlight.
Much of the recent enthusiasm comes down to renewed interest in derivatives trading, spurred by headlines around market volatility and institutional investors seeking new hedging strategies. For CME, the world’s leading derivatives marketplace, these trends have buoyed confidence, and the share price reflects that optimism.
But is CME stock truly undervalued at current levels? According to our valuation model, the company checks two out of six boxes when it comes to being undervalued, giving it a value score of 2. That means there is some potential, but it is not screamingly cheap yet. In the next section, we will dig deeper into each aspect of CME’s valuation, weighing different approaches to value, and later, explore an even smarter way of thinking about whether the stock belongs in your portfolio.
CME Group scores just 2/6 on our valuation checks. See what other red flags we found in the full valuation breakdown.
Approach 1: CME Group Excess Returns Analysis
The Excess Returns Model evaluates a company's ability to generate returns above its cost of equity by focusing on its return on invested capital and potential for continued shareholder value creation. For CME Group, the most relevant metrics include its book value, stable earnings per share (EPS), cost of equity, and the resulting "excess" return attributed to its investments.
CME's book value stands at $78.37 per share, while its stable EPS is projected at $12.25 per share, based on weighted future Return on Equity estimates from eight analysts. The company's estimated cost of equity is $6.31 per share, and its calculated excess return is $5.94 per share. With CME Group averaging a robust 15.74% return on equity, fueled by financial strength and consistent profitability, its stable book value is forecast at $77.83 per share (based on projections from five analysts).
Using these inputs, the Excess Returns Model calculates an intrinsic value for CME stock at $196.17 per share. Given the current market price, this suggests the stock is approximately 37.1% overvalued according to this method. Investors should take note that while CME consistently generates attractive returns, the shares appear richly priced by this model’s standards.
Result: OVERVALUED
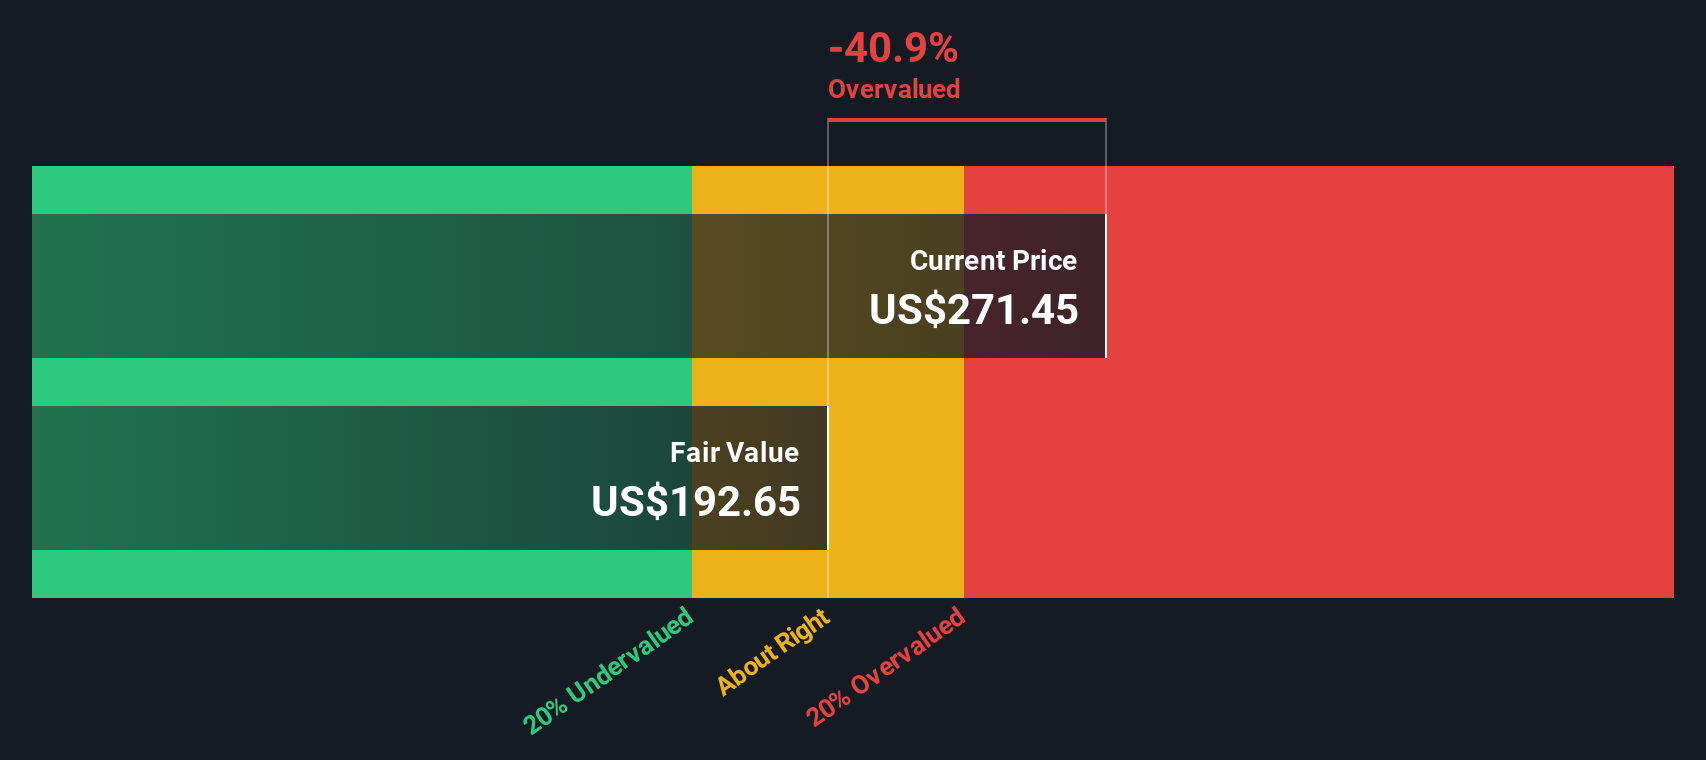
Our Excess Returns analysis suggests CME Group may be overvalued by 37.1%. Find undervalued stocks or create your own screener to find better value opportunities.
Approach 2: CME Group Price vs Earnings
The Price-to-Earnings (PE) ratio is considered the go-to valuation multiple for profitable companies like CME Group because it connects a company’s current market price with its actual ability to generate profits. Basically, it tells us how much investors are willing to pay for each dollar of earnings, making it a practical measure for comparing different stocks or judging whether a stock looks expensive or cheap based on its earnings power.
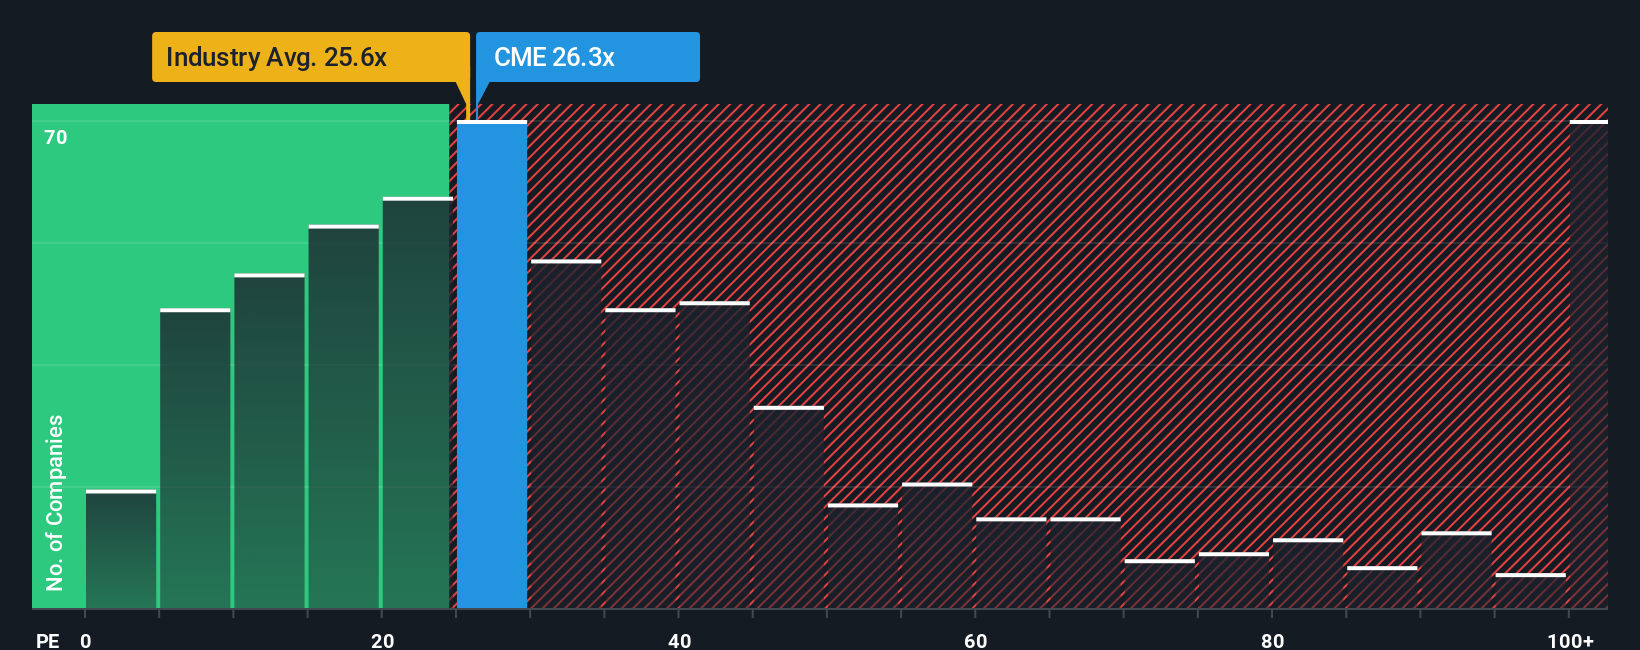
Of course, what counts as a “normal” PE ratio isn’t set in stone. Fast-growing companies or those seen as lower risk usually get a higher PE, while slow growers or riskier businesses tend to trade at a discount. That is why context matters, and why it is helpful to look at benchmarks. Right now, CME Group is trading at 26.1x earnings. That is almost the same as the broader Capital Markets industry average of 26.1x, but noticeably below the average of its main peers at 33.5x.
This is where Simply Wall St’s “Fair Ratio” comes in. Unlike a straight industry or peer comparison, the Fair Ratio (17.8x for CME) incorporates not just growth rates or market averages, but also specifics like the company’s size, profit margins, risks, and future prospects. This makes it a more tailored and meaningful yardstick when sizing up a stock’s value. In CME’s case, the actual PE is about 8.3 points higher than its Fair Ratio, signaling the stock could be trading at a premium relative to what you might expect given all key factors.
Result: OVERVALUED
PE ratios tell one story, but what if the real opportunity lies elsewhere? Discover companies where insiders are betting big on explosive growth.
Upgrade Your Decision Making: Choose your CME Group Narrative
Earlier, we mentioned that there is an even better way to understand valuation, so let us introduce you to Narratives. A Narrative is simply a story you create about a company; your perspective, based on what you believe about its business, growth, and prospects, which you link directly to key financial forecasts like future revenue, margins, and ultimately, its fair value.
Rather than relying solely on ratios or models, Narratives help you clearly connect your outlook for CME Group to numbers that matter, then compare your own Fair Value to the current share price to decide if it is time to buy, sell, or hold. These Narratives are easy to build and edit right from the Community page on Simply Wall St, where millions of investors share their views, and are automatically updated when new information or results come out, making your investment thesis dynamic and up to date.
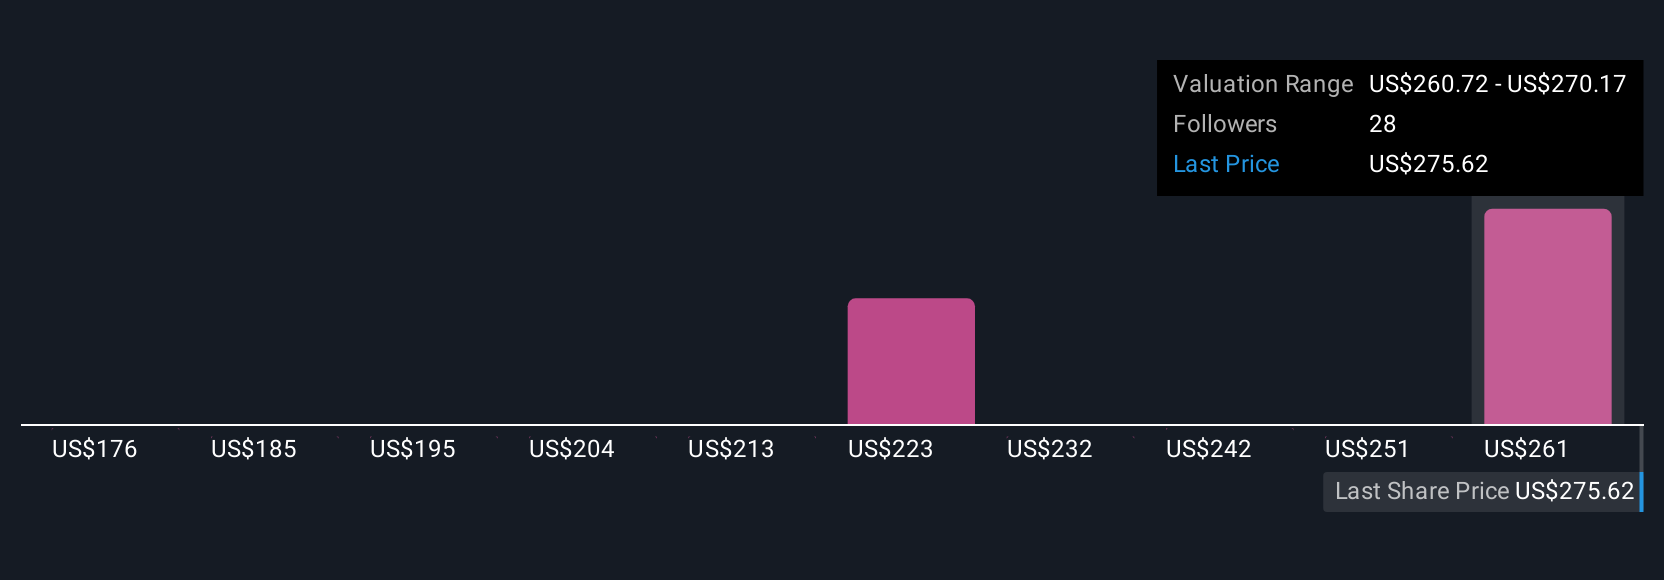
For example, different investors can have very different Narratives for CME Group. The most optimistic see international expansion and rising retail demand pushing the price as high as $313, while the most cautious believe regulatory risks or competition might limit potential to $212. You can weigh these perspectives, or build your own, to guide smarter investment decisions.
Do you think there's more to the story for CME Group? Create your own Narrative to let the Community know!
This article by Simply Wall St is general in nature. We provide commentary based on historical data and analyst forecasts only using an unbiased methodology and our articles are not intended to be financial advice. It does not constitute a recommendation to buy or sell any stock, and does not take account of your objectives, or your financial situation. We aim to bring you long-term focused analysis driven by fundamental data. Note that our analysis may not factor in the latest price-sensitive company announcements or qualitative material. Simply Wall St has no position in any stocks mentioned.
New: AI Stock Screener & Alerts
Our new AI Stock Screener scans the market every day to uncover opportunities.
• Dividend Powerhouses (3%+ Yield)
• Undervalued Small Caps with Insider Buying
• High growth Tech and AI Companies
Or build your own from over 50 metrics.
Have feedback on this article? Concerned about the content? Get in touch with us directly. Alternatively, email editorial-team@simplywallst.com
About NasdaqGS:CME
CME Group
Operates contract markets for the trading of futures and options on futures contracts worldwide.
Flawless balance sheet with acceptable track record.
Similar Companies
Market Insights

Advertisement
Community Narratives
Finding The True Value Of A Logistics Powerhouse
Fair Value US$95.21|8.6% undervalued
NV
Community Contributor
Paradigm Biopharmaceuticals Will Lead Osteoarthritis Treatment with Zilosul's FDA Success
Fair Value AU$5.50|92.1% undervalued
AM
Community Contributor
Barrick Mining (ABX:CA): A Gold Hedge against a U.S. Shutdown
Fair Value CA$60.00|25.6% undervalued
GM
Community Contributor